White/Caucasian vs Tlingit-Haida Child Poverty Among Boys Under 16
COMPARE
White/Caucasian
Tlingit-Haida
Child Poverty Among Boys Under 16
Child Poverty Among Boys Under 16 Comparison
Whites/Caucasians
Tlingit-Haida
16.5%
CHILD POVERTY AMONG BOYS UNDER 16
48.2/ 100
METRIC RATING
176th/ 347
METRIC RANK
15.3%
CHILD POVERTY AMONG BOYS UNDER 16
92.2/ 100
METRIC RATING
124th/ 347
METRIC RANK
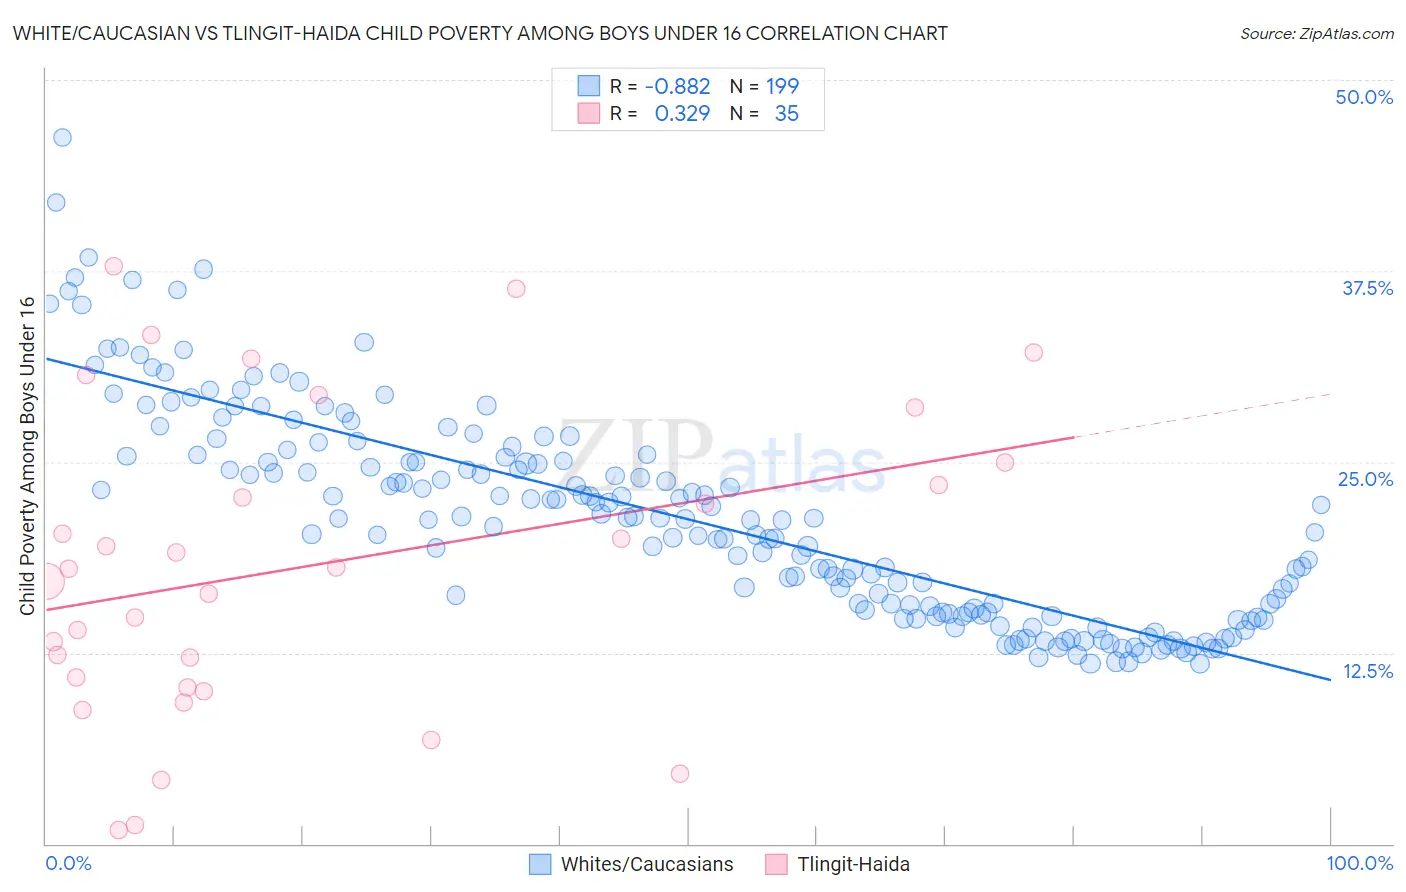
White/Caucasian vs Tlingit-Haida Child Poverty Among Boys Under 16 Correlation Chart
The statistical analysis conducted on geographies consisting of 560,435,427 people shows a very strong negative correlation between the proportion of Whites/Caucasians and poverty level among boys under the age of 16 in the United States with a correlation coefficient (R) of -0.882 and weighted average of 16.5%. Similarly, the statistical analysis conducted on geographies consisting of 60,443,448 people shows a mild positive correlation between the proportion of Tlingit-Haida and poverty level among boys under the age of 16 in the United States with a correlation coefficient (R) of 0.329 and weighted average of 15.3%, a difference of 7.6%.
Child Poverty Among Boys Under 16 Correlation Summary
| Measurement | White/Caucasian | Tlingit-Haida |
| Minimum | 11.8% | 0.92% |
| Maximum | 46.2% | 37.8% |
| Range | 34.4% | 36.9% |
| Mean | 21.3% | 18.1% |
| Median | 21.2% | 18.0% |
| Interquartile 25% (IQ1) | 15.1% | 10.2% |
| Interquartile 75% (IQ3) | 25.3% | 25.0% |
| Interquartile Range (IQR) | 10.2% | 14.8% |
| Standard Deviation (Sample) | 6.9% | 10.0% |
| Standard Deviation (Population) | 6.9% | 9.9% |
Similar Demographics by Child Poverty Among Boys Under 16
Demographics Similar to Whites/Caucasians by Child Poverty Among Boys Under 16
In terms of child poverty among boys under 16, the demographic groups most similar to Whites/Caucasians are Ethiopian (16.5%, a difference of 0.040%), Scotch-Irish (16.5%, a difference of 0.080%), Immigrants from Syria (16.5%, a difference of 0.090%), Hungarian (16.5%, a difference of 0.10%), and Uruguayan (16.4%, a difference of 0.20%).
| Demographics | Rating | Rank | Child Poverty Among Boys Under 16 |
| Immigrants | Saudi Arabia | 53.6 /100 | #169 | Average 16.4% |
| Immigrants | Bosnia and Herzegovina | 51.7 /100 | #170 | Average 16.4% |
| Immigrants | Ethiopia | 51.3 /100 | #171 | Average 16.4% |
| Immigrants | Colombia | 50.8 /100 | #172 | Average 16.4% |
| Tsimshian | 50.5 /100 | #173 | Average 16.4% |
| Uruguayans | 50.0 /100 | #174 | Average 16.4% |
| Immigrants | Syria | 49.0 /100 | #175 | Average 16.5% |
| Whites/Caucasians | 48.2 /100 | #176 | Average 16.5% |
| Ethiopians | 47.8 /100 | #177 | Average 16.5% |
| Scotch-Irish | 47.5 /100 | #178 | Average 16.5% |
| Hungarians | 47.3 /100 | #179 | Average 16.5% |
| Hawaiians | 45.5 /100 | #180 | Average 16.5% |
| South American Indians | 44.3 /100 | #181 | Average 16.5% |
| Lebanese | 43.3 /100 | #182 | Average 16.6% |
| Kenyans | 41.0 /100 | #183 | Average 16.6% |
Demographics Similar to Tlingit-Haida by Child Poverty Among Boys Under 16
In terms of child poverty among boys under 16, the demographic groups most similar to Tlingit-Haida are Immigrants from Norway (15.3%, a difference of 0.010%), Czechoslovakian (15.3%, a difference of 0.070%), Immigrants from Malaysia (15.3%, a difference of 0.23%), Scottish (15.2%, a difference of 0.33%), and South African (15.2%, a difference of 0.34%).
| Demographics | Rating | Rank | Child Poverty Among Boys Under 16 |
| Immigrants | Vietnam | 93.5 /100 | #117 | Exceptional 15.2% |
| Native Hawaiians | 93.4 /100 | #118 | Exceptional 15.2% |
| Belgians | 93.1 /100 | #119 | Exceptional 15.2% |
| South Africans | 93.0 /100 | #120 | Exceptional 15.2% |
| Scottish | 93.0 /100 | #121 | Exceptional 15.2% |
| Immigrants | Malaysia | 92.8 /100 | #122 | Exceptional 15.3% |
| Immigrants | Norway | 92.3 /100 | #123 | Exceptional 15.3% |
| Tlingit-Haida | 92.2 /100 | #124 | Exceptional 15.3% |
| Czechoslovakians | 92.1 /100 | #125 | Exceptional 15.3% |
| Palestinians | 91.3 /100 | #126 | Exceptional 15.4% |
| Carpatho Rusyns | 91.1 /100 | #127 | Exceptional 15.4% |
| Canadians | 90.6 /100 | #128 | Exceptional 15.4% |
| Immigrants | Brazil | 90.3 /100 | #129 | Exceptional 15.4% |
| Mongolians | 90.2 /100 | #130 | Exceptional 15.4% |
| Immigrants | Western Europe | 90.0 /100 | #131 | Exceptional 15.4% |