White/Caucasian vs Tlingit-Haida Unemployment Among Ages 60 to 64 years
COMPARE
White/Caucasian
Tlingit-Haida
Unemployment Among Ages 60 to 64 years
Unemployment Among Ages 60 to 64 years Comparison
Whites/Caucasians
Tlingit-Haida
4.7%
UNEMPLOYMENT AMONG AGES 60 TO 64 YEARS
97.8/ 100
METRIC RATING
103rd/ 347
METRIC RANK
6.4%
UNEMPLOYMENT AMONG AGES 60 TO 64 YEARS
0.0/ 100
METRIC RATING
339th/ 347
METRIC RANK
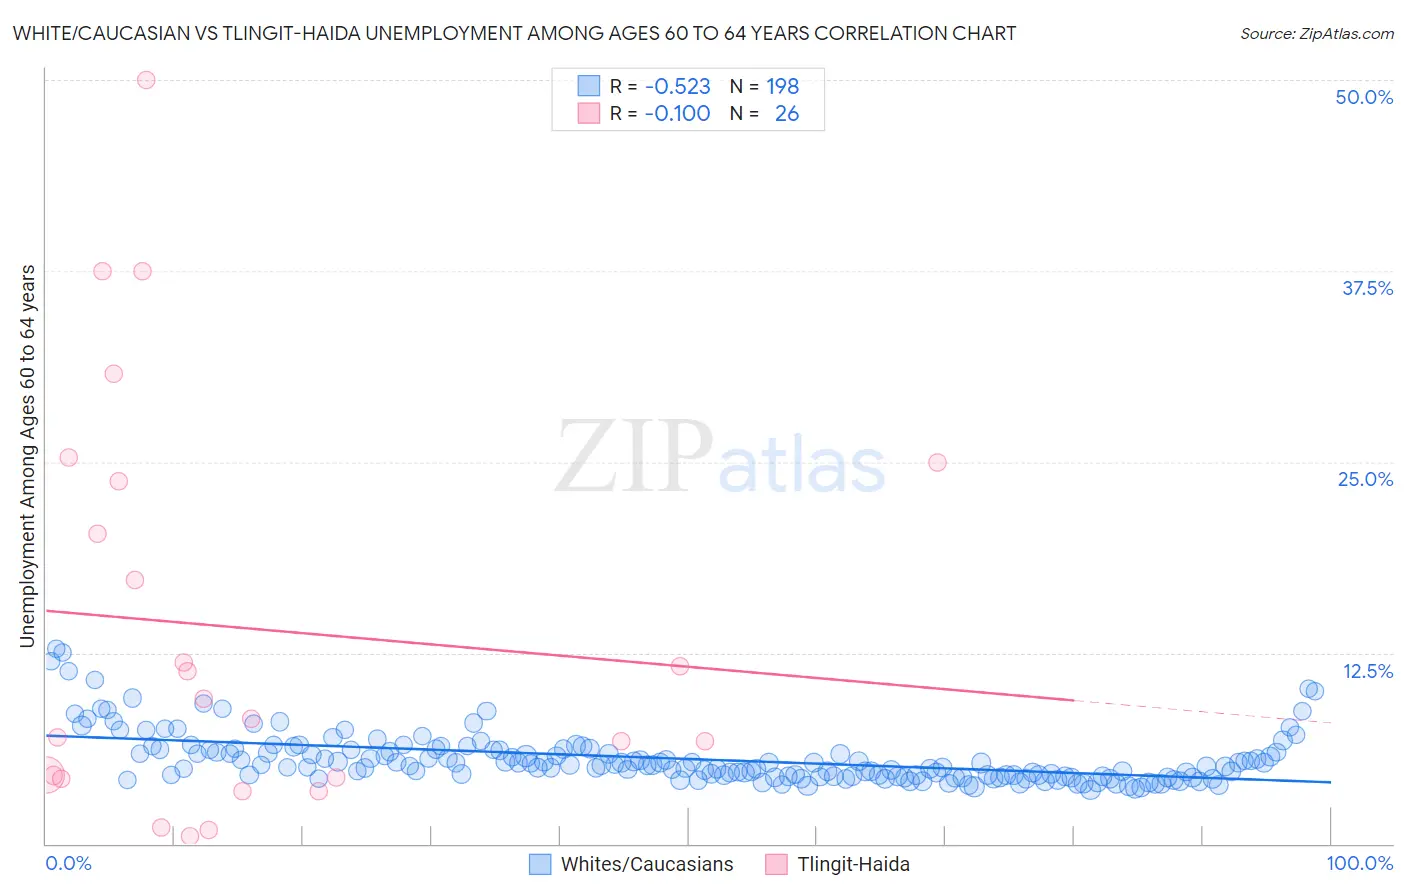
White/Caucasian vs Tlingit-Haida Unemployment Among Ages 60 to 64 years Correlation Chart
The statistical analysis conducted on geographies consisting of 469,979,801 people shows a substantial negative correlation between the proportion of Whites/Caucasians and unemployment rate among population between the ages 60 and 64 in the United States with a correlation coefficient (R) of -0.523 and weighted average of 4.7%. Similarly, the statistical analysis conducted on geographies consisting of 58,290,195 people shows a slight negative correlation between the proportion of Tlingit-Haida and unemployment rate among population between the ages 60 and 64 in the United States with a correlation coefficient (R) of -0.100 and weighted average of 6.4%, a difference of 36.1%.
Unemployment Among Ages 60 to 64 years Correlation Summary
| Measurement | White/Caucasian | Tlingit-Haida |
| Minimum | 3.5% | 0.50% |
| Maximum | 12.7% | 50.0% |
| Range | 9.2% | 49.5% |
| Mean | 5.6% | 14.1% |
| Median | 5.1% | 8.8% |
| Interquartile 25% (IQ1) | 4.4% | 4.3% |
| Interquartile 75% (IQ3) | 6.1% | 23.7% |
| Interquartile Range (IQR) | 1.7% | 19.4% |
| Standard Deviation (Sample) | 1.7% | 13.3% |
| Standard Deviation (Population) | 1.7% | 13.0% |
Similar Demographics by Unemployment Among Ages 60 to 64 years
Demographics Similar to Whites/Caucasians by Unemployment Among Ages 60 to 64 years
In terms of unemployment among ages 60 to 64 years, the demographic groups most similar to Whites/Caucasians are Immigrants from Canada (4.7%, a difference of 0.010%), Malaysian (4.7%, a difference of 0.020%), Portuguese (4.7%, a difference of 0.030%), Paraguayan (4.7%, a difference of 0.040%), and Egyptian (4.7%, a difference of 0.060%).
| Demographics | Rating | Rank | Unemployment Among Ages 60 to 64 years |
| Poles | 98.1 /100 | #96 | Exceptional 4.7% |
| Immigrants | Albania | 98.0 /100 | #97 | Exceptional 4.7% |
| Somalis | 98.0 /100 | #98 | Exceptional 4.7% |
| Egyptians | 98.0 /100 | #99 | Exceptional 4.7% |
| Portuguese | 97.9 /100 | #100 | Exceptional 4.7% |
| Malaysians | 97.9 /100 | #101 | Exceptional 4.7% |
| Immigrants | Canada | 97.8 /100 | #102 | Exceptional 4.7% |
| Whites/Caucasians | 97.8 /100 | #103 | Exceptional 4.7% |
| Paraguayans | 97.7 /100 | #104 | Exceptional 4.7% |
| Canadians | 97.7 /100 | #105 | Exceptional 4.7% |
| Immigrants | North America | 97.6 /100 | #106 | Exceptional 4.7% |
| Greeks | 97.5 /100 | #107 | Exceptional 4.7% |
| Immigrants | Japan | 97.4 /100 | #108 | Exceptional 4.7% |
| Immigrants | Netherlands | 97.4 /100 | #109 | Exceptional 4.7% |
| Ethiopians | 97.2 /100 | #110 | Exceptional 4.7% |
Demographics Similar to Tlingit-Haida by Unemployment Among Ages 60 to 64 years
In terms of unemployment among ages 60 to 64 years, the demographic groups most similar to Tlingit-Haida are Arapaho (6.3%, a difference of 1.4%), Navajo (6.3%, a difference of 1.9%), Kiowa (6.2%, a difference of 3.0%), Vietnamese (6.1%, a difference of 5.0%), and Puerto Rican (6.1%, a difference of 5.2%).
| Demographics | Rating | Rank | Unemployment Among Ages 60 to 64 years |
| Dominicans | 0.0 /100 | #332 | Tragic 6.0% |
| Immigrants | Dominican Republic | 0.0 /100 | #333 | Tragic 6.0% |
| Puerto Ricans | 0.0 /100 | #334 | Tragic 6.1% |
| Vietnamese | 0.0 /100 | #335 | Tragic 6.1% |
| Kiowa | 0.0 /100 | #336 | Tragic 6.2% |
| Navajo | 0.0 /100 | #337 | Tragic 6.3% |
| Arapaho | 0.0 /100 | #338 | Tragic 6.3% |
| Tlingit-Haida | 0.0 /100 | #339 | Tragic 6.4% |
| Pueblo | 0.0 /100 | #340 | Tragic 6.7% |
| Yuman | 0.0 /100 | #341 | Tragic 6.8% |
| Aleuts | 0.0 /100 | #342 | Tragic 6.8% |
| Immigrants | Yemen | 0.0 /100 | #343 | Tragic 6.8% |
| Alaska Natives | 0.0 /100 | #344 | Tragic 7.6% |
| Alaskan Athabascans | 0.0 /100 | #345 | Tragic 8.4% |
| Inupiat | 0.0 /100 | #346 | Tragic 9.6% |