British West Indian vs Tlingit-Haida Child Poverty Among Boys Under 16
COMPARE
British West Indian
Tlingit-Haida
Child Poverty Among Boys Under 16
Child Poverty Among Boys Under 16 Comparison
British West Indians
Tlingit-Haida
21.6%
CHILD POVERTY AMONG BOYS UNDER 16
0.0/ 100
METRIC RATING
313th/ 347
METRIC RANK
15.3%
CHILD POVERTY AMONG BOYS UNDER 16
92.2/ 100
METRIC RATING
124th/ 347
METRIC RANK
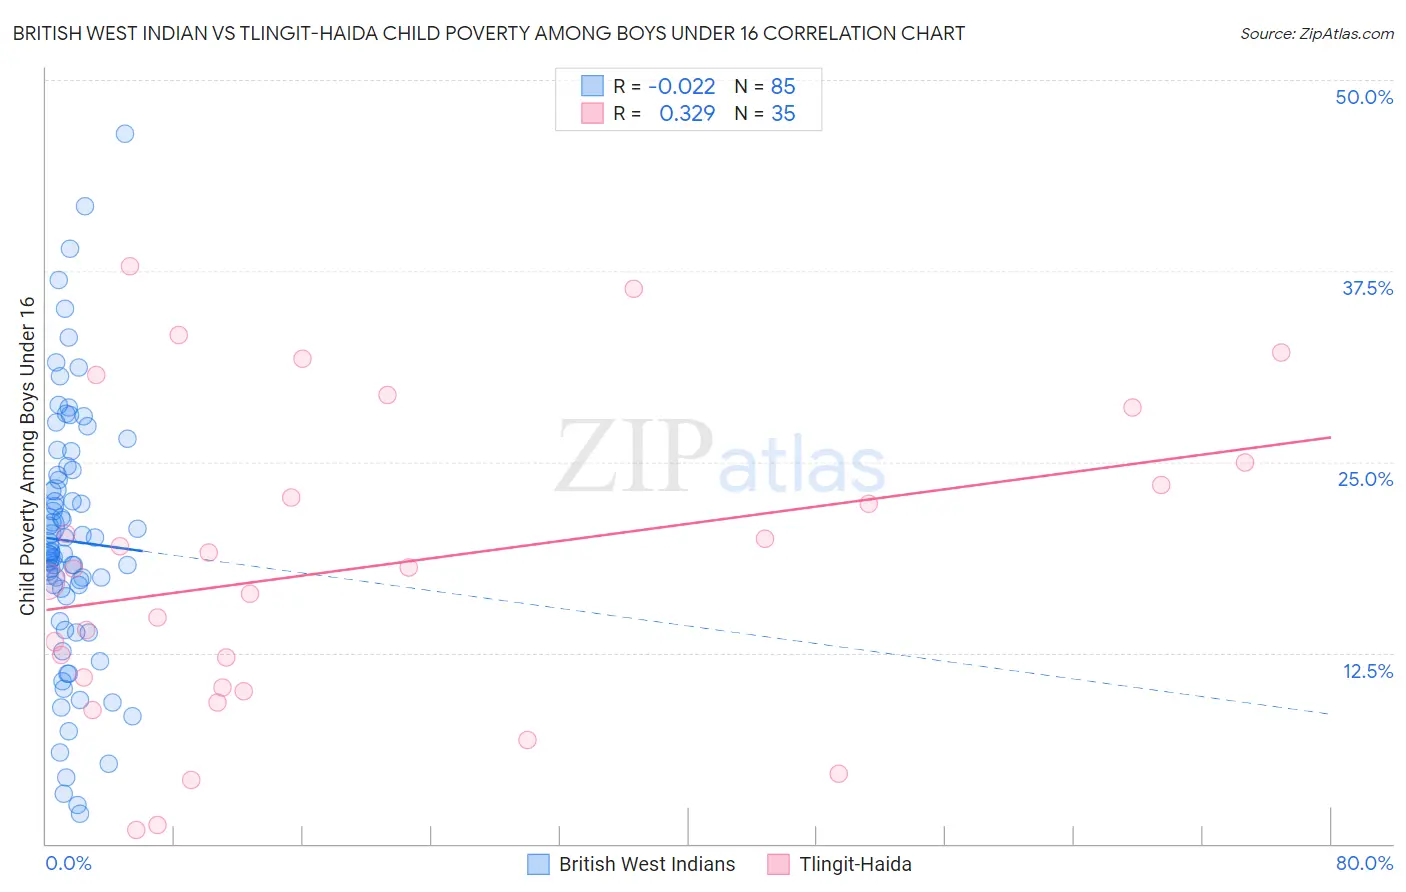
British West Indian vs Tlingit-Haida Child Poverty Among Boys Under 16 Correlation Chart
The statistical analysis conducted on geographies consisting of 151,753,314 people shows no correlation between the proportion of British West Indians and poverty level among boys under the age of 16 in the United States with a correlation coefficient (R) of -0.022 and weighted average of 21.6%. Similarly, the statistical analysis conducted on geographies consisting of 60,443,448 people shows a mild positive correlation between the proportion of Tlingit-Haida and poverty level among boys under the age of 16 in the United States with a correlation coefficient (R) of 0.329 and weighted average of 15.3%, a difference of 41.0%.
Child Poverty Among Boys Under 16 Correlation Summary
| Measurement | British West Indian | Tlingit-Haida |
| Minimum | 2.0% | 0.92% |
| Maximum | 46.4% | 37.8% |
| Range | 44.5% | 36.9% |
| Mean | 19.8% | 18.1% |
| Median | 19.1% | 18.0% |
| Interquartile 25% (IQ1) | 15.4% | 10.2% |
| Interquartile 75% (IQ3) | 24.3% | 25.0% |
| Interquartile Range (IQR) | 8.9% | 14.8% |
| Standard Deviation (Sample) | 8.6% | 10.0% |
| Standard Deviation (Population) | 8.5% | 9.9% |
Similar Demographics by Child Poverty Among Boys Under 16
Demographics Similar to British West Indians by Child Poverty Among Boys Under 16
In terms of child poverty among boys under 16, the demographic groups most similar to British West Indians are Immigrants from Guatemala (21.6%, a difference of 0.0%), Ute (21.6%, a difference of 0.010%), Bahamian (21.6%, a difference of 0.090%), Creek (21.5%, a difference of 0.20%), and Seminole (21.5%, a difference of 0.26%).
| Demographics | Rating | Rank | Child Poverty Among Boys Under 16 |
| Immigrants | Grenada | 0.0 /100 | #306 | Tragic 21.3% |
| Choctaw | 0.0 /100 | #307 | Tragic 21.3% |
| Immigrants | Mexico | 0.0 /100 | #308 | Tragic 21.5% |
| Seminole | 0.0 /100 | #309 | Tragic 21.5% |
| Creek | 0.0 /100 | #310 | Tragic 21.5% |
| Bahamians | 0.0 /100 | #311 | Tragic 21.6% |
| Immigrants | Guatemala | 0.0 /100 | #312 | Tragic 21.6% |
| British West Indians | 0.0 /100 | #313 | Tragic 21.6% |
| Ute | 0.0 /100 | #314 | Tragic 21.6% |
| Immigrants | Somalia | 0.0 /100 | #315 | Tragic 21.7% |
| Menominee | 0.0 /100 | #316 | Tragic 21.7% |
| Africans | 0.0 /100 | #317 | Tragic 21.7% |
| Yakama | 0.0 /100 | #318 | Tragic 21.7% |
| Dutch West Indians | 0.0 /100 | #319 | Tragic 21.8% |
| U.S. Virgin Islanders | 0.0 /100 | #320 | Tragic 22.0% |
Demographics Similar to Tlingit-Haida by Child Poverty Among Boys Under 16
In terms of child poverty among boys under 16, the demographic groups most similar to Tlingit-Haida are Immigrants from Norway (15.3%, a difference of 0.010%), Czechoslovakian (15.3%, a difference of 0.070%), Immigrants from Malaysia (15.3%, a difference of 0.23%), Scottish (15.2%, a difference of 0.33%), and South African (15.2%, a difference of 0.34%).
| Demographics | Rating | Rank | Child Poverty Among Boys Under 16 |
| Immigrants | Vietnam | 93.5 /100 | #117 | Exceptional 15.2% |
| Native Hawaiians | 93.4 /100 | #118 | Exceptional 15.2% |
| Belgians | 93.1 /100 | #119 | Exceptional 15.2% |
| South Africans | 93.0 /100 | #120 | Exceptional 15.2% |
| Scottish | 93.0 /100 | #121 | Exceptional 15.2% |
| Immigrants | Malaysia | 92.8 /100 | #122 | Exceptional 15.3% |
| Immigrants | Norway | 92.3 /100 | #123 | Exceptional 15.3% |
| Tlingit-Haida | 92.2 /100 | #124 | Exceptional 15.3% |
| Czechoslovakians | 92.1 /100 | #125 | Exceptional 15.3% |
| Palestinians | 91.3 /100 | #126 | Exceptional 15.4% |
| Carpatho Rusyns | 91.1 /100 | #127 | Exceptional 15.4% |
| Canadians | 90.6 /100 | #128 | Exceptional 15.4% |
| Immigrants | Brazil | 90.3 /100 | #129 | Exceptional 15.4% |
| Mongolians | 90.2 /100 | #130 | Exceptional 15.4% |
| Immigrants | Western Europe | 90.0 /100 | #131 | Exceptional 15.4% |