Pima vs Tlingit-Haida Child Poverty Among Boys Under 16
COMPARE
Pima
Tlingit-Haida
Child Poverty Among Boys Under 16
Child Poverty Among Boys Under 16 Comparison
Pima
Tlingit-Haida
29.7%
CHILD POVERTY AMONG BOYS UNDER 16
0.0/ 100
METRIC RATING
342nd/ 347
METRIC RANK
15.3%
CHILD POVERTY AMONG BOYS UNDER 16
92.2/ 100
METRIC RATING
124th/ 347
METRIC RANK
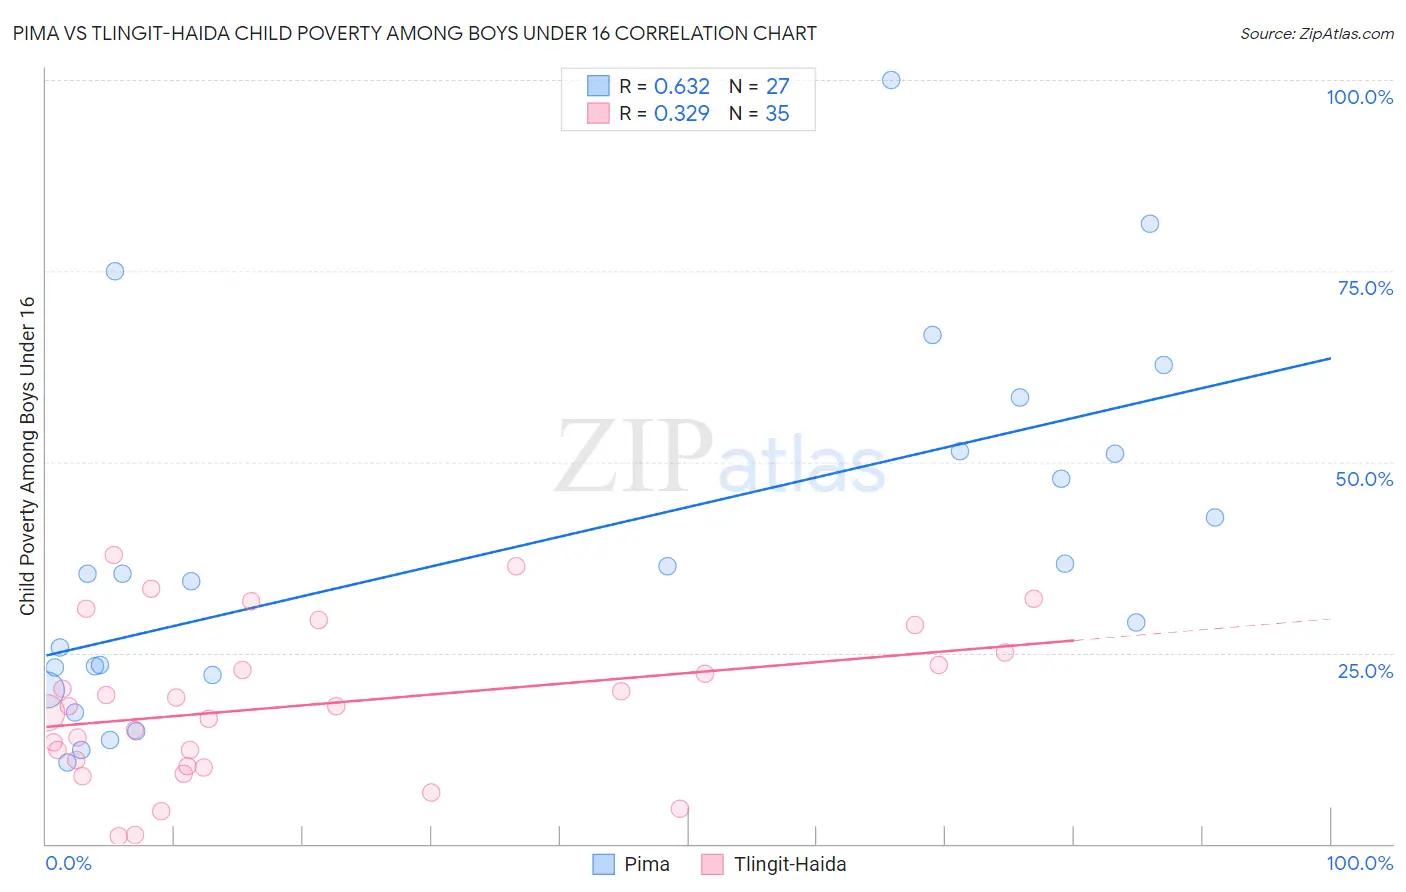
Pima vs Tlingit-Haida Child Poverty Among Boys Under 16 Correlation Chart
The statistical analysis conducted on geographies consisting of 61,443,182 people shows a significant positive correlation between the proportion of Pima and poverty level among boys under the age of 16 in the United States with a correlation coefficient (R) of 0.632 and weighted average of 29.7%. Similarly, the statistical analysis conducted on geographies consisting of 60,443,448 people shows a mild positive correlation between the proportion of Tlingit-Haida and poverty level among boys under the age of 16 in the United States with a correlation coefficient (R) of 0.329 and weighted average of 15.3%, a difference of 94.4%.
Child Poverty Among Boys Under 16 Correlation Summary
| Measurement | Pima | Tlingit-Haida |
| Minimum | 10.7% | 0.92% |
| Maximum | 100.0% | 37.8% |
| Range | 89.3% | 36.9% |
| Mean | 38.9% | 18.1% |
| Median | 35.3% | 18.0% |
| Interquartile 25% (IQ1) | 22.0% | 10.2% |
| Interquartile 75% (IQ3) | 51.5% | 25.0% |
| Interquartile Range (IQR) | 29.4% | 14.8% |
| Standard Deviation (Sample) | 23.1% | 10.0% |
| Standard Deviation (Population) | 22.6% | 9.9% |
Similar Demographics by Child Poverty Among Boys Under 16
Demographics Similar to Pima by Child Poverty Among Boys Under 16
In terms of child poverty among boys under 16, the demographic groups most similar to Pima are Navajo (30.3%, a difference of 1.8%), Yuman (30.6%, a difference of 3.0%), Immigrants from Yemen (28.9%, a difference of 3.1%), Tohono O'odham (31.6%, a difference of 6.1%), and Lumbee (31.9%, a difference of 7.3%).
| Demographics | Rating | Rank | Child Poverty Among Boys Under 16 |
| Apache | 0.0 /100 | #333 | Tragic 24.5% |
| Blacks/African Americans | 0.0 /100 | #334 | Tragic 24.5% |
| Yup'ik | 0.0 /100 | #335 | Tragic 24.7% |
| Sioux | 0.0 /100 | #336 | Tragic 25.3% |
| Cheyenne | 0.0 /100 | #337 | Tragic 25.8% |
| Hopi | 0.0 /100 | #338 | Tragic 25.9% |
| Houma | 0.0 /100 | #339 | Tragic 26.2% |
| Crow | 0.0 /100 | #340 | Tragic 26.3% |
| Immigrants | Yemen | 0.0 /100 | #341 | Tragic 28.9% |
| Pima | 0.0 /100 | #342 | Tragic 29.7% |
| Navajo | 0.0 /100 | #343 | Tragic 30.3% |
| Yuman | 0.0 /100 | #344 | Tragic 30.6% |
| Tohono O'odham | 0.0 /100 | #345 | Tragic 31.6% |
| Lumbee | 0.0 /100 | #346 | Tragic 31.9% |
| Puerto Ricans | 0.0 /100 | #347 | Tragic 32.8% |
Demographics Similar to Tlingit-Haida by Child Poverty Among Boys Under 16
In terms of child poverty among boys under 16, the demographic groups most similar to Tlingit-Haida are Immigrants from Norway (15.3%, a difference of 0.010%), Czechoslovakian (15.3%, a difference of 0.070%), Immigrants from Malaysia (15.3%, a difference of 0.23%), Scottish (15.2%, a difference of 0.33%), and South African (15.2%, a difference of 0.34%).
| Demographics | Rating | Rank | Child Poverty Among Boys Under 16 |
| Immigrants | Vietnam | 93.5 /100 | #117 | Exceptional 15.2% |
| Native Hawaiians | 93.4 /100 | #118 | Exceptional 15.2% |
| Belgians | 93.1 /100 | #119 | Exceptional 15.2% |
| South Africans | 93.0 /100 | #120 | Exceptional 15.2% |
| Scottish | 93.0 /100 | #121 | Exceptional 15.2% |
| Immigrants | Malaysia | 92.8 /100 | #122 | Exceptional 15.3% |
| Immigrants | Norway | 92.3 /100 | #123 | Exceptional 15.3% |
| Tlingit-Haida | 92.2 /100 | #124 | Exceptional 15.3% |
| Czechoslovakians | 92.1 /100 | #125 | Exceptional 15.3% |
| Palestinians | 91.3 /100 | #126 | Exceptional 15.4% |
| Carpatho Rusyns | 91.1 /100 | #127 | Exceptional 15.4% |
| Canadians | 90.6 /100 | #128 | Exceptional 15.4% |
| Immigrants | Brazil | 90.3 /100 | #129 | Exceptional 15.4% |
| Mongolians | 90.2 /100 | #130 | Exceptional 15.4% |
| Immigrants | Western Europe | 90.0 /100 | #131 | Exceptional 15.4% |