White/Caucasian vs Ottawa Child Poverty Among Boys Under 16
COMPARE
White/Caucasian
Ottawa
Child Poverty Among Boys Under 16
Child Poverty Among Boys Under 16 Comparison
Whites/Caucasians
Ottawa
16.5%
CHILD POVERTY AMONG BOYS UNDER 16
48.2/ 100
METRIC RATING
176th/ 347
METRIC RANK
19.5%
CHILD POVERTY AMONG BOYS UNDER 16
0.1/ 100
METRIC RATING
263rd/ 347
METRIC RANK
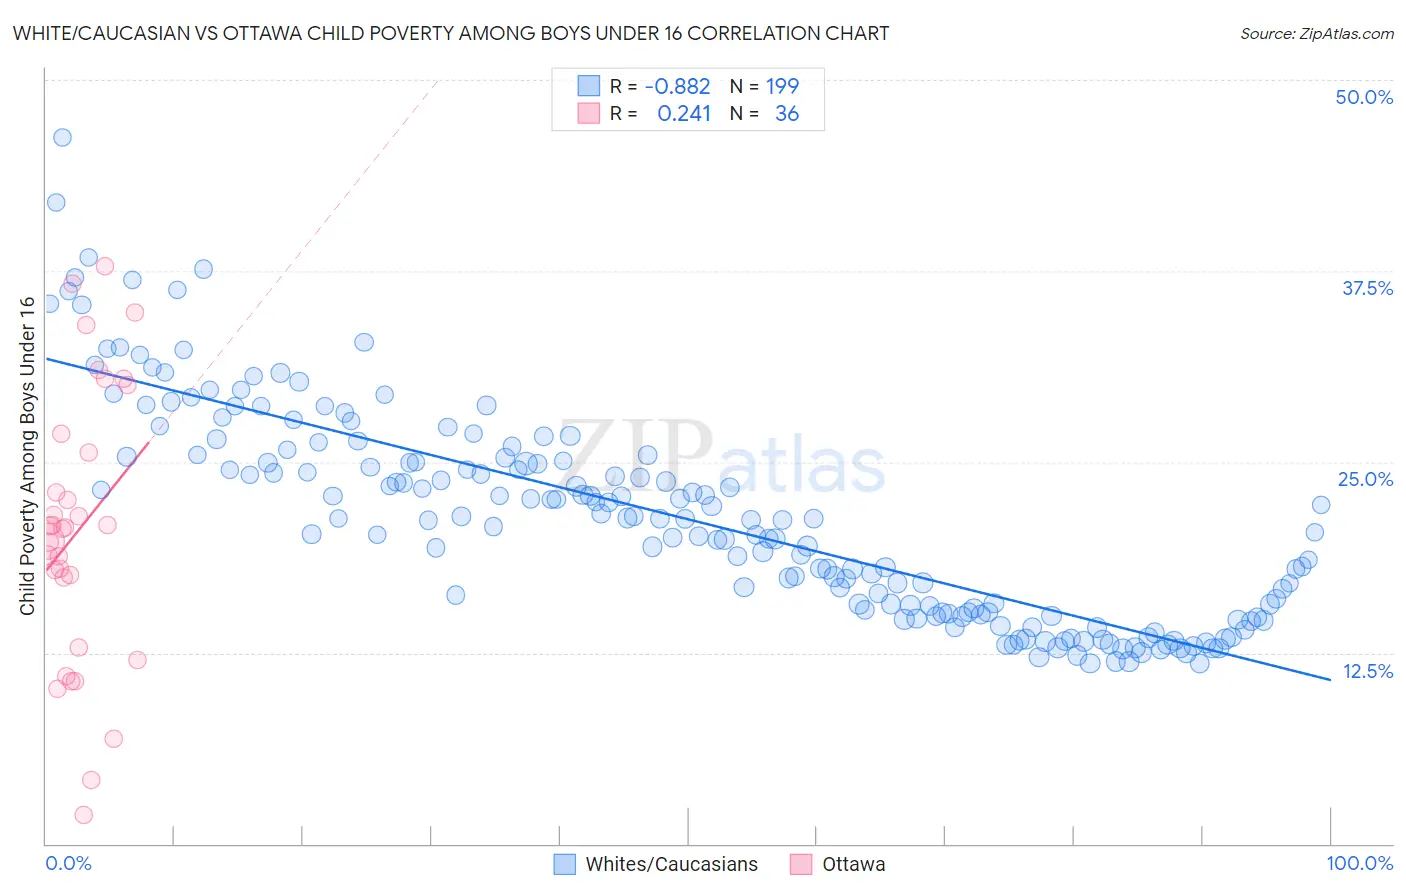
White/Caucasian vs Ottawa Child Poverty Among Boys Under 16 Correlation Chart
The statistical analysis conducted on geographies consisting of 560,435,427 people shows a very strong negative correlation between the proportion of Whites/Caucasians and poverty level among boys under the age of 16 in the United States with a correlation coefficient (R) of -0.882 and weighted average of 16.5%. Similarly, the statistical analysis conducted on geographies consisting of 49,695,002 people shows a weak positive correlation between the proportion of Ottawa and poverty level among boys under the age of 16 in the United States with a correlation coefficient (R) of 0.241 and weighted average of 19.5%, a difference of 18.6%.
Child Poverty Among Boys Under 16 Correlation Summary
| Measurement | White/Caucasian | Ottawa |
| Minimum | 11.8% | 1.9% |
| Maximum | 46.2% | 37.8% |
| Range | 34.4% | 35.9% |
| Mean | 21.3% | 20.5% |
| Median | 21.2% | 20.6% |
| Interquartile 25% (IQ1) | 15.1% | 15.1% |
| Interquartile 75% (IQ3) | 25.3% | 26.2% |
| Interquartile Range (IQR) | 10.2% | 11.1% |
| Standard Deviation (Sample) | 6.9% | 8.9% |
| Standard Deviation (Population) | 6.9% | 8.8% |
Similar Demographics by Child Poverty Among Boys Under 16
Demographics Similar to Whites/Caucasians by Child Poverty Among Boys Under 16
In terms of child poverty among boys under 16, the demographic groups most similar to Whites/Caucasians are Ethiopian (16.5%, a difference of 0.040%), Scotch-Irish (16.5%, a difference of 0.080%), Immigrants from Syria (16.5%, a difference of 0.090%), Hungarian (16.5%, a difference of 0.10%), and Uruguayan (16.4%, a difference of 0.20%).
| Demographics | Rating | Rank | Child Poverty Among Boys Under 16 |
| Immigrants | Saudi Arabia | 53.6 /100 | #169 | Average 16.4% |
| Immigrants | Bosnia and Herzegovina | 51.7 /100 | #170 | Average 16.4% |
| Immigrants | Ethiopia | 51.3 /100 | #171 | Average 16.4% |
| Immigrants | Colombia | 50.8 /100 | #172 | Average 16.4% |
| Tsimshian | 50.5 /100 | #173 | Average 16.4% |
| Uruguayans | 50.0 /100 | #174 | Average 16.4% |
| Immigrants | Syria | 49.0 /100 | #175 | Average 16.5% |
| Whites/Caucasians | 48.2 /100 | #176 | Average 16.5% |
| Ethiopians | 47.8 /100 | #177 | Average 16.5% |
| Scotch-Irish | 47.5 /100 | #178 | Average 16.5% |
| Hungarians | 47.3 /100 | #179 | Average 16.5% |
| Hawaiians | 45.5 /100 | #180 | Average 16.5% |
| South American Indians | 44.3 /100 | #181 | Average 16.5% |
| Lebanese | 43.3 /100 | #182 | Average 16.6% |
| Kenyans | 41.0 /100 | #183 | Average 16.6% |
Demographics Similar to Ottawa by Child Poverty Among Boys Under 16
In terms of child poverty among boys under 16, the demographic groups most similar to Ottawa are Iroquois (19.6%, a difference of 0.22%), Immigrants from Guyana (19.5%, a difference of 0.31%), Guyanese (19.6%, a difference of 0.32%), Immigrants from El Salvador (19.6%, a difference of 0.36%), and Vietnamese (19.6%, a difference of 0.37%).
| Demographics | Rating | Rank | Child Poverty Among Boys Under 16 |
| Immigrants | Liberia | 0.2 /100 | #256 | Tragic 19.3% |
| Mexican American Indians | 0.2 /100 | #257 | Tragic 19.4% |
| Potawatomi | 0.2 /100 | #258 | Tragic 19.4% |
| Spanish Americans | 0.2 /100 | #259 | Tragic 19.4% |
| Shoshone | 0.2 /100 | #260 | Tragic 19.4% |
| Immigrants | Ghana | 0.2 /100 | #261 | Tragic 19.4% |
| Immigrants | Guyana | 0.1 /100 | #262 | Tragic 19.5% |
| Ottawa | 0.1 /100 | #263 | Tragic 19.5% |
| Iroquois | 0.1 /100 | #264 | Tragic 19.6% |
| Guyanese | 0.1 /100 | #265 | Tragic 19.6% |
| Immigrants | El Salvador | 0.1 /100 | #266 | Tragic 19.6% |
| Vietnamese | 0.1 /100 | #267 | Tragic 19.6% |
| Spanish American Indians | 0.1 /100 | #268 | Tragic 19.6% |
| Immigrants | Cabo Verde | 0.1 /100 | #269 | Tragic 19.7% |
| Cherokee | 0.1 /100 | #270 | Tragic 19.7% |