Cypriot vs Haitian Child Poverty Among Girls Under 16
COMPARE
Cypriot
Haitian
Child Poverty Among Girls Under 16
Child Poverty Among Girls Under 16 Comparison
Cypriots
Haitians
13.2%
CHILD POVERTY AMONG GIRLS UNDER 16
99.9/ 100
METRIC RATING
19th/ 347
METRIC RANK
20.5%
CHILD POVERTY AMONG GIRLS UNDER 16
0.0/ 100
METRIC RATING
288th/ 347
METRIC RANK
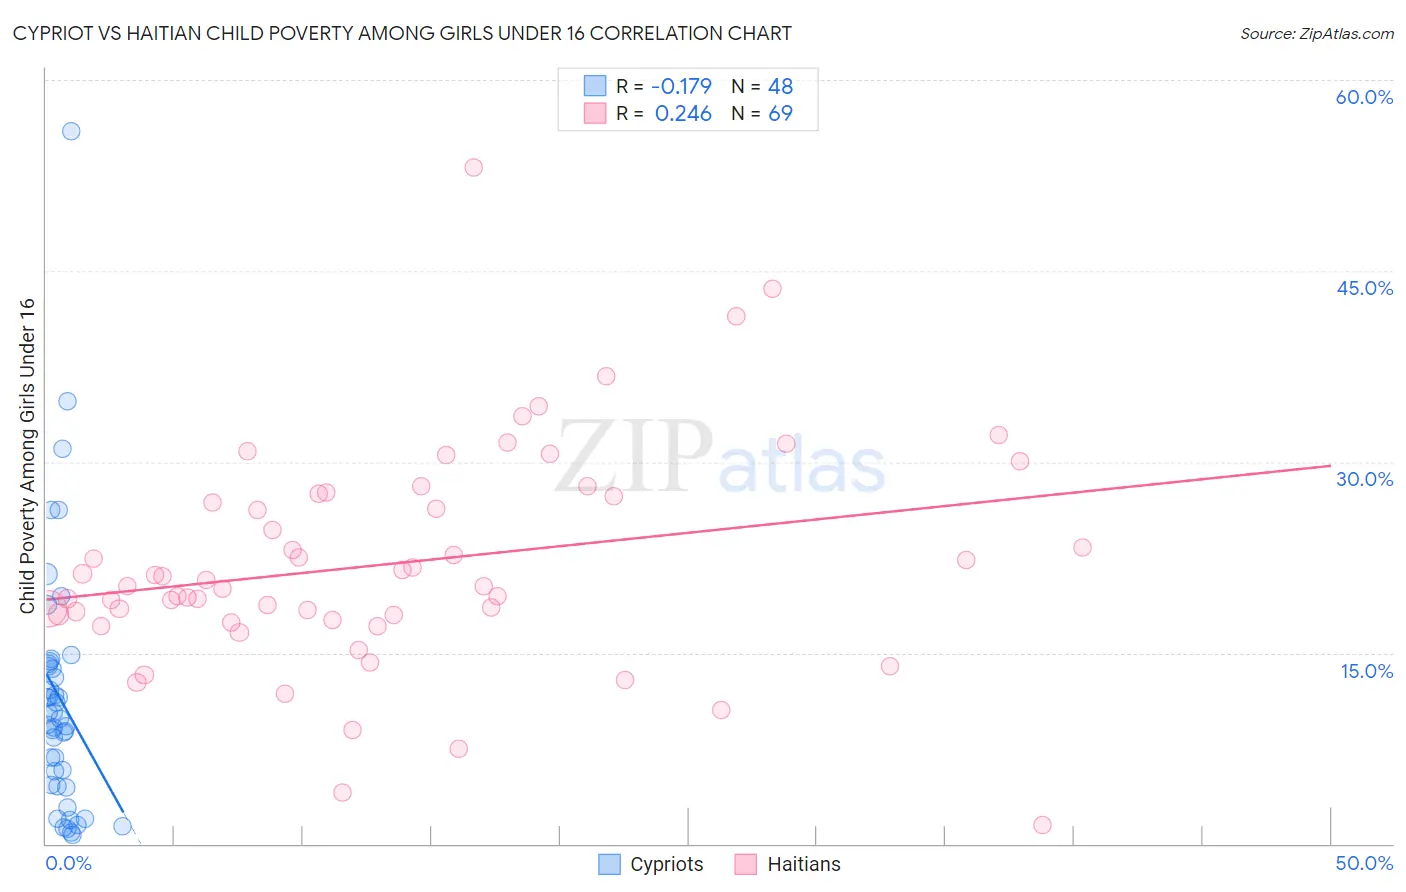
Cypriot vs Haitian Child Poverty Among Girls Under 16 Correlation Chart
The statistical analysis conducted on geographies consisting of 61,269,149 people shows a poor negative correlation between the proportion of Cypriots and poverty level among girls under the age of 16 in the United States with a correlation coefficient (R) of -0.179 and weighted average of 13.2%. Similarly, the statistical analysis conducted on geographies consisting of 284,231,337 people shows a weak positive correlation between the proportion of Haitians and poverty level among girls under the age of 16 in the United States with a correlation coefficient (R) of 0.246 and weighted average of 20.5%, a difference of 55.3%.
Child Poverty Among Girls Under 16 Correlation Summary
| Measurement | Cypriot | Haitian |
| Minimum | 0.71% | 1.5% |
| Maximum | 55.9% | 53.2% |
| Range | 55.2% | 51.7% |
| Mean | 11.4% | 22.0% |
| Median | 9.6% | 20.2% |
| Interquartile 25% (IQ1) | 4.6% | 17.8% |
| Interquartile 75% (IQ3) | 14.1% | 27.4% |
| Interquartile Range (IQR) | 9.5% | 9.6% |
| Standard Deviation (Sample) | 10.2% | 8.7% |
| Standard Deviation (Population) | 10.1% | 8.7% |
Similar Demographics by Child Poverty Among Girls Under 16
Demographics Similar to Cypriots by Child Poverty Among Girls Under 16
In terms of child poverty among girls under 16, the demographic groups most similar to Cypriots are Immigrants from Korea (13.1%, a difference of 0.37%), Bulgarian (13.1%, a difference of 0.39%), Immigrants from Lithuania (13.1%, a difference of 0.47%), Immigrants from Japan (13.3%, a difference of 0.66%), and Assyrian/Chaldean/Syriac (13.3%, a difference of 0.78%).
| Demographics | Rating | Rank | Child Poverty Among Girls Under 16 |
| Bhutanese | 100.0 /100 | #12 | Exceptional 12.7% |
| Immigrants | Ireland | 99.9 /100 | #13 | Exceptional 12.9% |
| Burmese | 99.9 /100 | #14 | Exceptional 13.0% |
| Okinawans | 99.9 /100 | #15 | Exceptional 13.0% |
| Immigrants | Lithuania | 99.9 /100 | #16 | Exceptional 13.1% |
| Bulgarians | 99.9 /100 | #17 | Exceptional 13.1% |
| Immigrants | Korea | 99.9 /100 | #18 | Exceptional 13.1% |
| Cypriots | 99.9 /100 | #19 | Exceptional 13.2% |
| Immigrants | Japan | 99.9 /100 | #20 | Exceptional 13.3% |
| Assyrians/Chaldeans/Syriacs | 99.9 /100 | #21 | Exceptional 13.3% |
| Indians (Asian) | 99.9 /100 | #22 | Exceptional 13.3% |
| Norwegians | 99.9 /100 | #23 | Exceptional 13.3% |
| Immigrants | Eastern Asia | 99.9 /100 | #24 | Exceptional 13.4% |
| Immigrants | China | 99.8 /100 | #25 | Exceptional 13.4% |
| Eastern Europeans | 99.8 /100 | #26 | Exceptional 13.5% |
Demographics Similar to Haitians by Child Poverty Among Girls Under 16
In terms of child poverty among girls under 16, the demographic groups most similar to Haitians are Blackfeet (20.5%, a difference of 0.20%), Iroquois (20.4%, a difference of 0.34%), Immigrants from Belize (20.6%, a difference of 0.46%), Immigrants from Haiti (20.6%, a difference of 0.53%), and Chippewa (20.6%, a difference of 0.67%).
| Demographics | Rating | Rank | Child Poverty Among Girls Under 16 |
| Central Americans | 0.0 /100 | #281 | Tragic 20.2% |
| West Indians | 0.0 /100 | #282 | Tragic 20.3% |
| Senegalese | 0.0 /100 | #283 | Tragic 20.3% |
| Yaqui | 0.0 /100 | #284 | Tragic 20.3% |
| Immigrants | Cabo Verde | 0.0 /100 | #285 | Tragic 20.3% |
| Iroquois | 0.0 /100 | #286 | Tragic 20.4% |
| Blackfeet | 0.0 /100 | #287 | Tragic 20.5% |
| Haitians | 0.0 /100 | #288 | Tragic 20.5% |
| Immigrants | Belize | 0.0 /100 | #289 | Tragic 20.6% |
| Immigrants | Haiti | 0.0 /100 | #290 | Tragic 20.6% |
| Chippewa | 0.0 /100 | #291 | Tragic 20.6% |
| Immigrants | Latin America | 0.0 /100 | #292 | Tragic 20.6% |
| Immigrants | Grenada | 0.0 /100 | #293 | Tragic 20.7% |
| Immigrants | Senegal | 0.0 /100 | #294 | Tragic 20.7% |
| Immigrants | Caribbean | 0.0 /100 | #295 | Tragic 20.7% |