Immigrants from Albania vs Austrian Child Poverty Among Girls Under 16
COMPARE
Immigrants from Albania
Austrian
Child Poverty Among Girls Under 16
Child Poverty Among Girls Under 16 Comparison
Immigrants from Albania
Austrians
15.8%
CHILD POVERTY AMONG GIRLS UNDER 16
80.7/ 100
METRIC RATING
150th/ 347
METRIC RANK
14.9%
CHILD POVERTY AMONG GIRLS UNDER 16
96.7/ 100
METRIC RATING
92nd/ 347
METRIC RANK
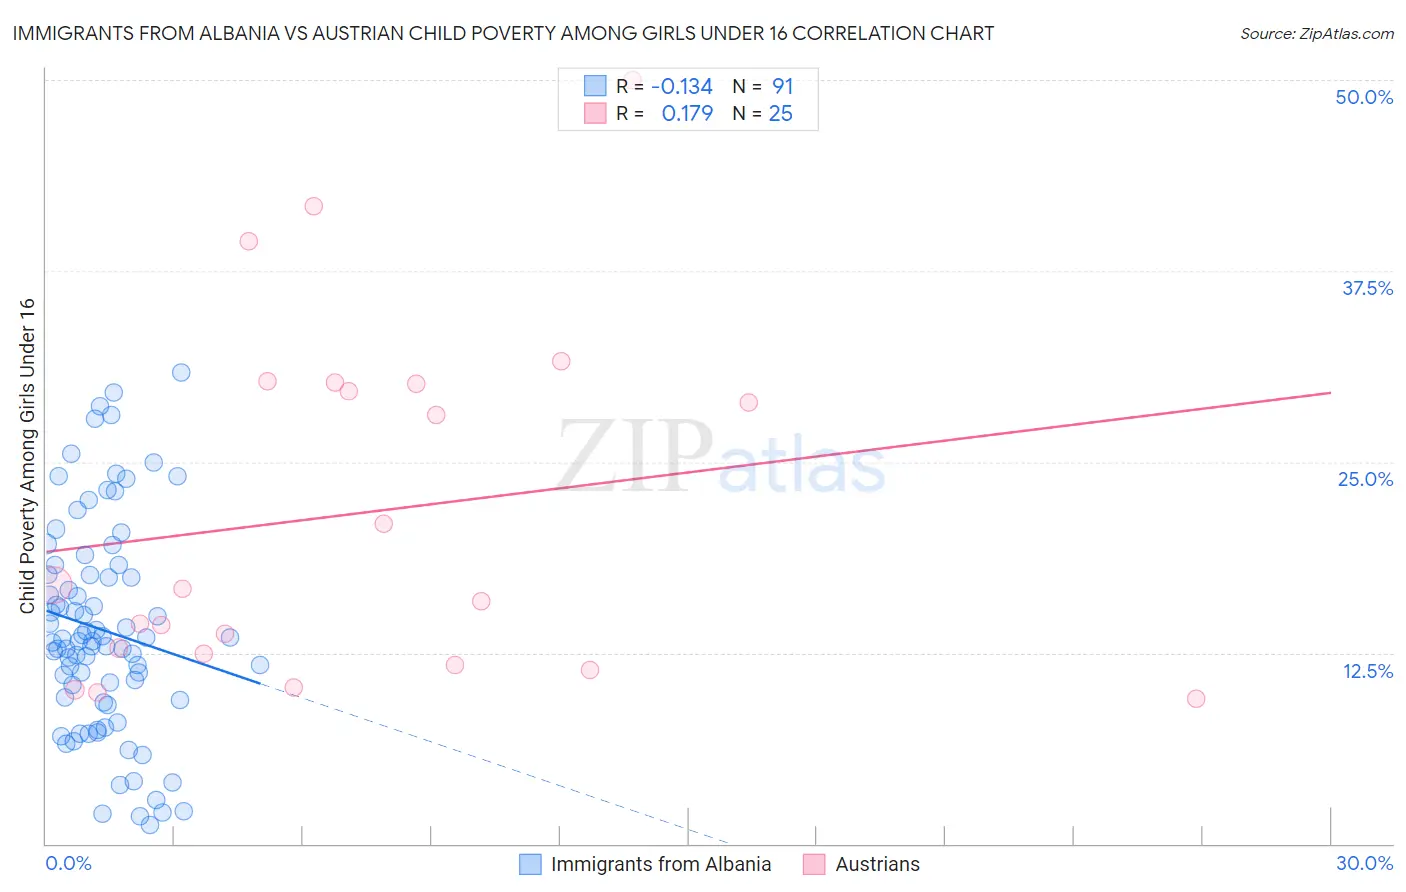
Immigrants from Albania vs Austrian Child Poverty Among Girls Under 16 Correlation Chart
The statistical analysis conducted on geographies consisting of 118,242,796 people shows a poor negative correlation between the proportion of Immigrants from Albania and poverty level among girls under the age of 16 in the United States with a correlation coefficient (R) of -0.134 and weighted average of 15.8%. Similarly, the statistical analysis conducted on geographies consisting of 439,542,815 people shows a poor positive correlation between the proportion of Austrians and poverty level among girls under the age of 16 in the United States with a correlation coefficient (R) of 0.179 and weighted average of 14.9%, a difference of 6.2%.
Child Poverty Among Girls Under 16 Correlation Summary
| Measurement | Immigrants from Albania | Austrian |
| Minimum | 1.2% | 9.5% |
| Maximum | 30.9% | 50.0% |
| Range | 29.7% | 40.5% |
| Mean | 14.0% | 21.6% |
| Median | 13.2% | 16.7% |
| Interquartile 25% (IQ1) | 9.4% | 12.1% |
| Interquartile 75% (IQ3) | 17.6% | 30.2% |
| Interquartile Range (IQR) | 8.2% | 18.1% |
| Standard Deviation (Sample) | 6.9% | 11.5% |
| Standard Deviation (Population) | 6.9% | 11.3% |
Similar Demographics by Child Poverty Among Girls Under 16
Demographics Similar to Immigrants from Albania by Child Poverty Among Girls Under 16
In terms of child poverty among girls under 16, the demographic groups most similar to Immigrants from Albania are Immigrants from Hungary (15.8%, a difference of 0.040%), Venezuelan (15.8%, a difference of 0.10%), Immigrants from Kuwait (15.8%, a difference of 0.24%), Icelander (15.7%, a difference of 0.35%), and Immigrants from Nepal (15.9%, a difference of 0.40%).
| Demographics | Rating | Rank | Child Poverty Among Girls Under 16 |
| Immigrants | Peru | 86.6 /100 | #143 | Excellent 15.6% |
| Israelis | 86.3 /100 | #144 | Excellent 15.6% |
| Welsh | 85.4 /100 | #145 | Excellent 15.6% |
| Samoans | 84.2 /100 | #146 | Excellent 15.7% |
| Slavs | 83.1 /100 | #147 | Excellent 15.7% |
| Icelanders | 82.4 /100 | #148 | Excellent 15.7% |
| Immigrants | Hungary | 80.9 /100 | #149 | Excellent 15.8% |
| Immigrants | Albania | 80.7 /100 | #150 | Excellent 15.8% |
| Venezuelans | 80.1 /100 | #151 | Excellent 15.8% |
| Immigrants | Kuwait | 79.4 /100 | #152 | Good 15.8% |
| Immigrants | Nepal | 78.5 /100 | #153 | Good 15.9% |
| Immigrants | Chile | 76.7 /100 | #154 | Good 15.9% |
| Syrians | 76.7 /100 | #155 | Good 15.9% |
| Immigrants | Fiji | 76.1 /100 | #156 | Good 15.9% |
| Colombians | 76.1 /100 | #157 | Good 15.9% |
Demographics Similar to Austrians by Child Poverty Among Girls Under 16
In terms of child poverty among girls under 16, the demographic groups most similar to Austrians are Immigrants from North America (14.9%, a difference of 0.070%), Immigrants from Switzerland (14.9%, a difference of 0.34%), Immigrants from Belarus (14.8%, a difference of 0.35%), German (14.9%, a difference of 0.36%), and Northern European (14.8%, a difference of 0.39%).
| Demographics | Rating | Rank | Child Poverty Among Girls Under 16 |
| Swiss | 97.2 /100 | #85 | Exceptional 14.8% |
| Australians | 97.2 /100 | #86 | Exceptional 14.8% |
| Finns | 97.2 /100 | #87 | Exceptional 14.8% |
| Immigrants | Canada | 97.1 /100 | #88 | Exceptional 14.8% |
| Jordanians | 97.1 /100 | #89 | Exceptional 14.8% |
| Northern Europeans | 97.0 /100 | #90 | Exceptional 14.8% |
| Immigrants | Belarus | 97.0 /100 | #91 | Exceptional 14.8% |
| Austrians | 96.7 /100 | #92 | Exceptional 14.9% |
| Immigrants | North America | 96.6 /100 | #93 | Exceptional 14.9% |
| Immigrants | Switzerland | 96.3 /100 | #94 | Exceptional 14.9% |
| Germans | 96.3 /100 | #95 | Exceptional 14.9% |
| Immigrants | France | 96.2 /100 | #96 | Exceptional 14.9% |
| Immigrants | Latvia | 96.1 /100 | #97 | Exceptional 14.9% |
| Basques | 95.9 /100 | #98 | Exceptional 15.0% |
| Immigrants | Egypt | 95.7 /100 | #99 | Exceptional 15.0% |