Cajun vs French Female Poverty
COMPARE
Cajun
French
Female Poverty
Female Poverty Comparison
Cajuns
French
17.5%
FEMALE POVERTY
0.0/ 100
METRIC RATING
319th/ 347
METRIC RANK
12.9%
FEMALE POVERTY
85.6/ 100
METRIC RATING
135th/ 347
METRIC RANK
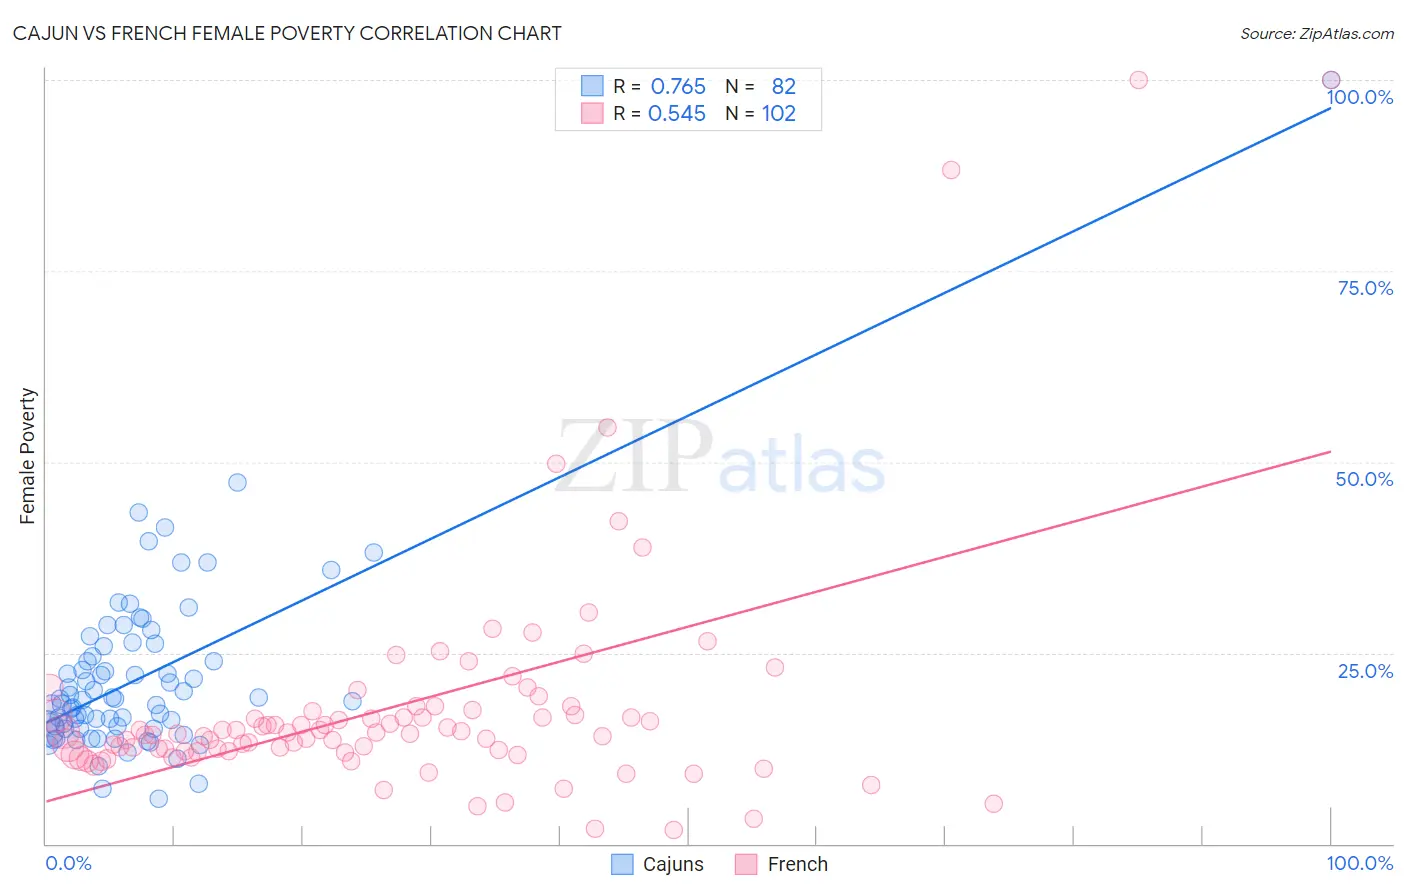
Cajun vs French Female Poverty Correlation Chart
The statistical analysis conducted on geographies consisting of 149,687,613 people shows a strong positive correlation between the proportion of Cajuns and poverty level among females in the United States with a correlation coefficient (R) of 0.765 and weighted average of 17.5%. Similarly, the statistical analysis conducted on geographies consisting of 571,140,753 people shows a substantial positive correlation between the proportion of French and poverty level among females in the United States with a correlation coefficient (R) of 0.545 and weighted average of 12.9%, a difference of 35.7%.
Female Poverty Correlation Summary
| Measurement | Cajun | French |
| Minimum | 5.9% | 1.8% |
| Maximum | 100.0% | 100.0% |
| Range | 94.1% | 98.2% |
| Mean | 21.9% | 18.1% |
| Median | 18.9% | 14.5% |
| Interquartile 25% (IQ1) | 15.1% | 12.1% |
| Interquartile 75% (IQ3) | 25.9% | 17.4% |
| Interquartile Range (IQR) | 10.8% | 5.3% |
| Standard Deviation (Sample) | 12.1% | 15.9% |
| Standard Deviation (Population) | 12.1% | 15.8% |
Similar Demographics by Female Poverty
Demographics Similar to Cajuns by Female Poverty
In terms of female poverty, the demographic groups most similar to Cajuns are Ute (17.5%, a difference of 0.010%), Immigrants from Dominica (17.5%, a difference of 0.080%), Arapaho (17.5%, a difference of 0.15%), Immigrants from Congo (17.4%, a difference of 0.34%), and Honduran (17.4%, a difference of 0.53%).
| Demographics | Rating | Rank | Female Poverty |
| Immigrants | Somalia | 0.0 /100 | #312 | Tragic 17.0% |
| British West Indians | 0.0 /100 | #313 | Tragic 17.0% |
| Dutch West Indians | 0.0 /100 | #314 | Tragic 17.1% |
| U.S. Virgin Islanders | 0.0 /100 | #315 | Tragic 17.3% |
| Hondurans | 0.0 /100 | #316 | Tragic 17.4% |
| Immigrants | Congo | 0.0 /100 | #317 | Tragic 17.4% |
| Ute | 0.0 /100 | #318 | Tragic 17.5% |
| Cajuns | 0.0 /100 | #319 | Tragic 17.5% |
| Immigrants | Dominica | 0.0 /100 | #320 | Tragic 17.5% |
| Arapaho | 0.0 /100 | #321 | Tragic 17.5% |
| Menominee | 0.0 /100 | #322 | Tragic 17.6% |
| Paiute | 0.0 /100 | #323 | Tragic 17.7% |
| Immigrants | Honduras | 0.0 /100 | #324 | Tragic 17.7% |
| Colville | 0.0 /100 | #325 | Tragic 17.8% |
| Central American Indians | 0.0 /100 | #326 | Tragic 18.0% |
Demographics Similar to French by Female Poverty
In terms of female poverty, the demographic groups most similar to French are Immigrants from Switzerland (12.9%, a difference of 0.050%), Peruvian (12.9%, a difference of 0.080%), Chilean (12.9%, a difference of 0.17%), Immigrants from Western Europe (12.8%, a difference of 0.22%), and Immigrants from Jordan (12.8%, a difference of 0.28%).
| Demographics | Rating | Rank | Female Poverty |
| Immigrants | Belarus | 88.2 /100 | #128 | Excellent 12.8% |
| Immigrants | Brazil | 87.9 /100 | #129 | Excellent 12.8% |
| Immigrants | Vietnam | 87.1 /100 | #130 | Excellent 12.8% |
| Immigrants | Argentina | 87.0 /100 | #131 | Excellent 12.8% |
| Immigrants | Jordan | 86.9 /100 | #132 | Excellent 12.8% |
| Immigrants | Western Europe | 86.6 /100 | #133 | Excellent 12.8% |
| Immigrants | Switzerland | 85.8 /100 | #134 | Excellent 12.9% |
| French | 85.6 /100 | #135 | Excellent 12.9% |
| Peruvians | 85.2 /100 | #136 | Excellent 12.9% |
| Chileans | 84.7 /100 | #137 | Excellent 12.9% |
| Immigrants | France | 83.6 /100 | #138 | Excellent 12.9% |
| Basques | 83.1 /100 | #139 | Excellent 12.9% |
| Pakistanis | 83.0 /100 | #140 | Excellent 12.9% |
| Icelanders | 81.1 /100 | #141 | Excellent 13.0% |
| Brazilians | 80.5 /100 | #142 | Excellent 13.0% |