West Indian vs French High School Diploma
COMPARE
West Indian
French
High School Diploma
High School Diploma Comparison
West Indians
French
86.9%
HIGH SCHOOL DIPLOMA
0.1/ 100
METRIC RATING
271st/ 347
METRIC RANK
91.0%
HIGH SCHOOL DIPLOMA
99.5/ 100
METRIC RATING
66th/ 347
METRIC RANK
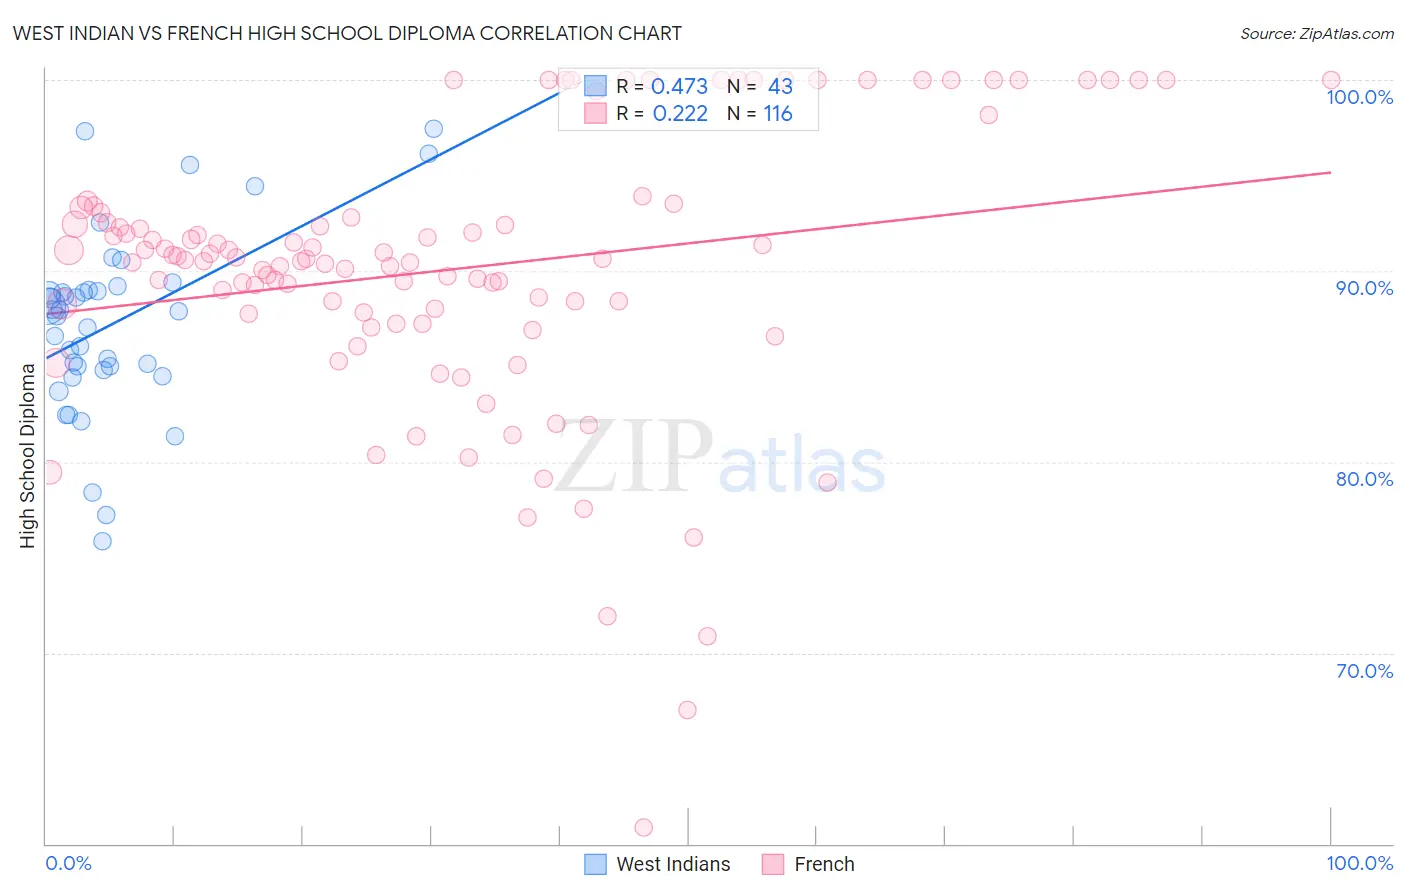
West Indian vs French High School Diploma Correlation Chart
The statistical analysis conducted on geographies consisting of 254,059,006 people shows a moderate positive correlation between the proportion of West Indians and percentage of population with at least high school diploma education in the United States with a correlation coefficient (R) of 0.473 and weighted average of 86.9%. Similarly, the statistical analysis conducted on geographies consisting of 572,427,361 people shows a weak positive correlation between the proportion of French and percentage of population with at least high school diploma education in the United States with a correlation coefficient (R) of 0.222 and weighted average of 91.0%, a difference of 4.6%.
High School Diploma Correlation Summary
| Measurement | West Indian | French |
| Minimum | 75.8% | 60.9% |
| Maximum | 97.5% | 100.0% |
| Range | 21.7% | 39.1% |
| Mean | 87.3% | 90.1% |
| Median | 87.9% | 90.6% |
| Interquartile 25% (IQ1) | 84.8% | 87.8% |
| Interquartile 75% (IQ3) | 89.0% | 92.9% |
| Interquartile Range (IQR) | 4.2% | 5.1% |
| Standard Deviation (Sample) | 4.8% | 7.3% |
| Standard Deviation (Population) | 4.7% | 7.2% |
Similar Demographics by High School Diploma
Demographics Similar to West Indians by High School Diploma
In terms of high school diploma, the demographic groups most similar to West Indians are Trinidadian and Tobagonian (86.9%, a difference of 0.010%), Immigrants from Jamaica (86.9%, a difference of 0.040%), Bangladeshi (86.9%, a difference of 0.050%), Malaysian (87.0%, a difference of 0.070%), and Sri Lankan (87.0%, a difference of 0.080%).
| Demographics | Rating | Rank | High School Diploma |
| Jamaicans | 0.3 /100 | #264 | Tragic 87.2% |
| U.S. Virgin Islanders | 0.2 /100 | #265 | Tragic 87.1% |
| Immigrants | Congo | 0.2 /100 | #266 | Tragic 87.0% |
| Blacks/African Americans | 0.2 /100 | #267 | Tragic 87.0% |
| Pennsylvania Germans | 0.2 /100 | #268 | Tragic 87.0% |
| Sri Lankans | 0.2 /100 | #269 | Tragic 87.0% |
| Malaysians | 0.2 /100 | #270 | Tragic 87.0% |
| West Indians | 0.1 /100 | #271 | Tragic 86.9% |
| Trinidadians and Tobagonians | 0.1 /100 | #272 | Tragic 86.9% |
| Immigrants | Jamaica | 0.1 /100 | #273 | Tragic 86.9% |
| Bangladeshis | 0.1 /100 | #274 | Tragic 86.9% |
| Immigrants | Trinidad and Tobago | 0.1 /100 | #275 | Tragic 86.8% |
| Immigrants | Burma/Myanmar | 0.1 /100 | #276 | Tragic 86.7% |
| Barbadians | 0.1 /100 | #277 | Tragic 86.7% |
| Hopi | 0.1 /100 | #278 | Tragic 86.6% |
Demographics Similar to French by High School Diploma
In terms of high school diploma, the demographic groups most similar to French are Ukrainian (91.0%, a difference of 0.010%), Immigrants from South Africa (91.0%, a difference of 0.010%), Immigrants from Netherlands (91.0%, a difference of 0.020%), Immigrants from Iran (90.9%, a difference of 0.020%), and Czechoslovakian (90.9%, a difference of 0.030%).
| Demographics | Rating | Rank | High School Diploma |
| Immigrants | North America | 99.7 /100 | #59 | Exceptional 91.0% |
| Immigrants | Japan | 99.6 /100 | #60 | Exceptional 91.0% |
| Immigrants | Taiwan | 99.6 /100 | #61 | Exceptional 91.0% |
| Austrians | 99.6 /100 | #62 | Exceptional 91.0% |
| Immigrants | Netherlands | 99.6 /100 | #63 | Exceptional 91.0% |
| Ukrainians | 99.6 /100 | #64 | Exceptional 91.0% |
| Immigrants | South Africa | 99.6 /100 | #65 | Exceptional 91.0% |
| French | 99.5 /100 | #66 | Exceptional 91.0% |
| Immigrants | Iran | 99.5 /100 | #67 | Exceptional 90.9% |
| Czechoslovakians | 99.5 /100 | #68 | Exceptional 90.9% |
| French Canadians | 99.5 /100 | #69 | Exceptional 90.9% |
| Immigrants | Latvia | 99.5 /100 | #70 | Exceptional 90.9% |
| Alaskan Athabascans | 99.4 /100 | #71 | Exceptional 90.9% |
| Soviet Union | 99.4 /100 | #72 | Exceptional 90.9% |
| Immigrants | South Central Asia | 99.4 /100 | #73 | Exceptional 90.9% |