West Indian vs French Unemployment Among Ages 16 to 19 years
COMPARE
West Indian
French
Unemployment Among Ages 16 to 19 years
Unemployment Among Ages 16 to 19 years Comparison
West Indians
French
22.4%
UNEMPLOYMENT AMONG AGES 16 TO 19 YEARS
0.0/ 100
METRIC RATING
321st/ 347
METRIC RANK
16.8%
UNEMPLOYMENT AMONG AGES 16 TO 19 YEARS
97.4/ 100
METRIC RATING
84th/ 347
METRIC RANK
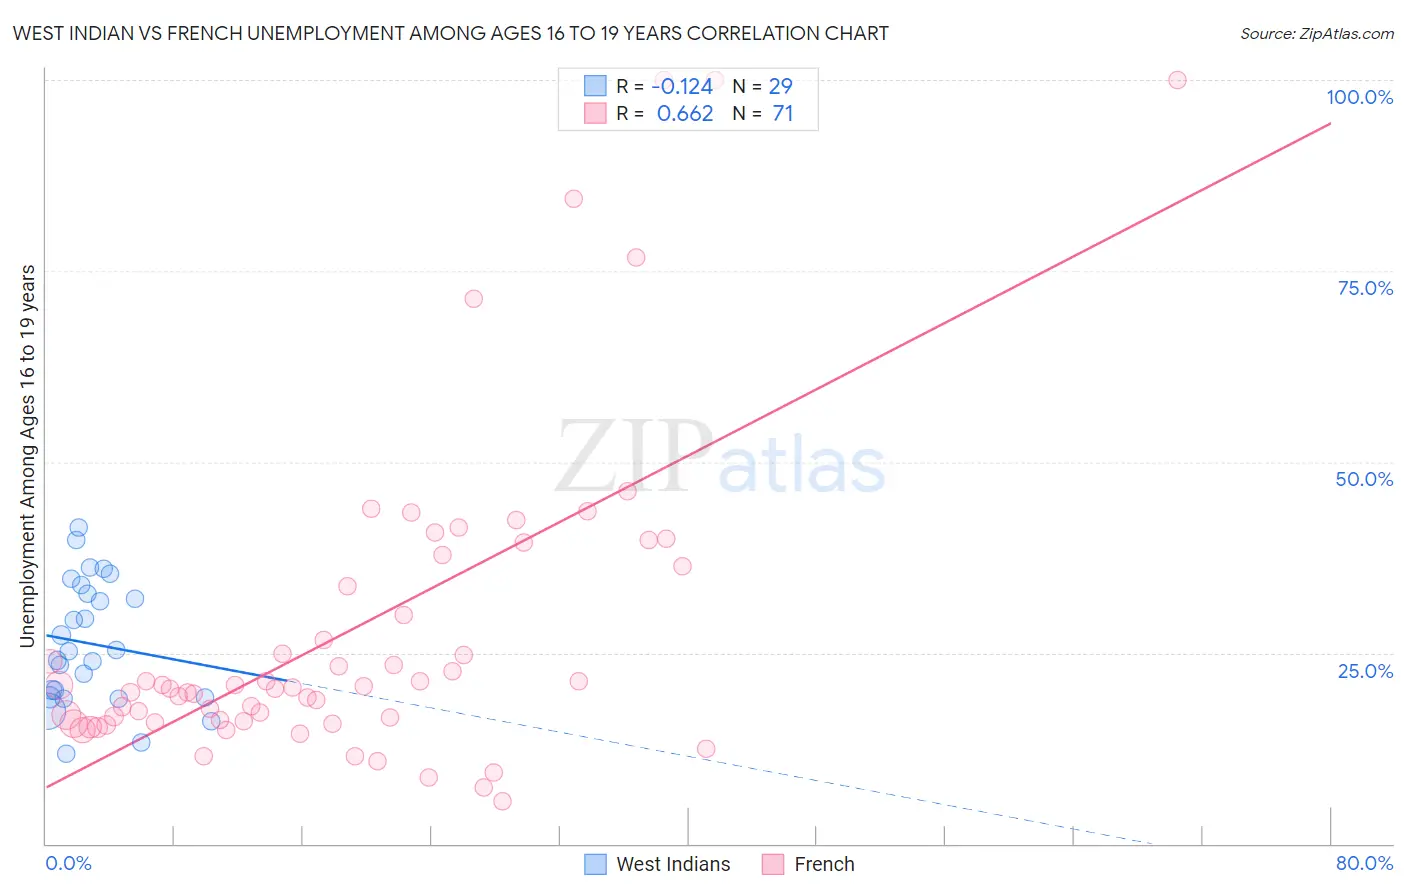
West Indian vs French Unemployment Among Ages 16 to 19 years Correlation Chart
The statistical analysis conducted on geographies consisting of 246,291,481 people shows a poor negative correlation between the proportion of West Indians and unemployment rate among population between the ages 16 and 19 in the United States with a correlation coefficient (R) of -0.124 and weighted average of 22.4%. Similarly, the statistical analysis conducted on geographies consisting of 509,205,056 people shows a significant positive correlation between the proportion of French and unemployment rate among population between the ages 16 and 19 in the United States with a correlation coefficient (R) of 0.662 and weighted average of 16.8%, a difference of 33.3%.
Unemployment Among Ages 16 to 19 years Correlation Summary
| Measurement | West Indian | French |
| Minimum | 11.7% | 5.6% |
| Maximum | 41.3% | 100.0% |
| Range | 29.6% | 94.4% |
| Mean | 26.2% | 28.1% |
| Median | 25.2% | 20.5% |
| Interquartile 25% (IQ1) | 19.1% | 16.0% |
| Interquartile 75% (IQ3) | 33.3% | 36.4% |
| Interquartile Range (IQR) | 14.2% | 20.4% |
| Standard Deviation (Sample) | 8.1% | 21.3% |
| Standard Deviation (Population) | 7.9% | 21.1% |
Similar Demographics by Unemployment Among Ages 16 to 19 years
Demographics Similar to West Indians by Unemployment Among Ages 16 to 19 years
In terms of unemployment among ages 16 to 19 years, the demographic groups most similar to West Indians are Barbadian (22.5%, a difference of 0.14%), Yakama (22.5%, a difference of 0.36%), Cheyenne (22.3%, a difference of 0.70%), Immigrants from Armenia (22.6%, a difference of 0.81%), and Immigrants from West Indies (22.2%, a difference of 0.92%).
| Demographics | Rating | Rank | Unemployment Among Ages 16 to 19 years |
| Alaska Natives | 0.0 /100 | #314 | Tragic 21.8% |
| Immigrants | Dominica | 0.0 /100 | #315 | Tragic 21.9% |
| Tohono O'odham | 0.0 /100 | #316 | Tragic 22.1% |
| Immigrants | Belize | 0.0 /100 | #317 | Tragic 22.2% |
| Immigrants | Jamaica | 0.0 /100 | #318 | Tragic 22.2% |
| Immigrants | West Indies | 0.0 /100 | #319 | Tragic 22.2% |
| Cheyenne | 0.0 /100 | #320 | Tragic 22.3% |
| West Indians | 0.0 /100 | #321 | Tragic 22.4% |
| Barbadians | 0.0 /100 | #322 | Tragic 22.5% |
| Yakama | 0.0 /100 | #323 | Tragic 22.5% |
| Immigrants | Armenia | 0.0 /100 | #324 | Tragic 22.6% |
| Trinidadians and Tobagonians | 0.0 /100 | #325 | Tragic 22.6% |
| Immigrants | Trinidad and Tobago | 0.0 /100 | #326 | Tragic 23.1% |
| Pima | 0.0 /100 | #327 | Tragic 23.1% |
| Immigrants | Dominican Republic | 0.0 /100 | #328 | Tragic 23.3% |
Demographics Similar to French by Unemployment Among Ages 16 to 19 years
In terms of unemployment among ages 16 to 19 years, the demographic groups most similar to French are Ugandan (16.8%, a difference of 0.040%), White/Caucasian (16.8%, a difference of 0.050%), Slovak (16.8%, a difference of 0.060%), French Canadian (16.8%, a difference of 0.060%), and Immigrants from Latvia (16.8%, a difference of 0.060%).
| Demographics | Rating | Rank | Unemployment Among Ages 16 to 19 years |
| Immigrants | Singapore | 97.8 /100 | #77 | Exceptional 16.8% |
| Soviet Union | 97.8 /100 | #78 | Exceptional 16.8% |
| Slovaks | 97.5 /100 | #79 | Exceptional 16.8% |
| French Canadians | 97.5 /100 | #80 | Exceptional 16.8% |
| Immigrants | Latvia | 97.5 /100 | #81 | Exceptional 16.8% |
| Whites/Caucasians | 97.5 /100 | #82 | Exceptional 16.8% |
| Ugandans | 97.4 /100 | #83 | Exceptional 16.8% |
| French | 97.4 /100 | #84 | Exceptional 16.8% |
| Immigrants | Kuwait | 97.2 /100 | #85 | Exceptional 16.8% |
| Immigrants | Scotland | 97.2 /100 | #86 | Exceptional 16.8% |
| Greeks | 97.0 /100 | #87 | Exceptional 16.9% |
| Immigrants | South Africa | 96.9 /100 | #88 | Exceptional 16.9% |
| Canadians | 96.7 /100 | #89 | Exceptional 16.9% |
| Asians | 96.6 /100 | #90 | Exceptional 16.9% |
| Cambodians | 96.3 /100 | #91 | Exceptional 16.9% |