Welsh vs Nepalese Disability Age Over 75
COMPARE
Welsh
Nepalese
Disability Age Over 75
Disability Age Over 75 Comparison
Welsh
Nepalese
47.0%
DISABILITY AGE OVER 75
81.3/ 100
METRIC RATING
149th/ 347
METRIC RANK
52.6%
DISABILITY AGE OVER 75
0.0/ 100
METRIC RATING
327th/ 347
METRIC RANK
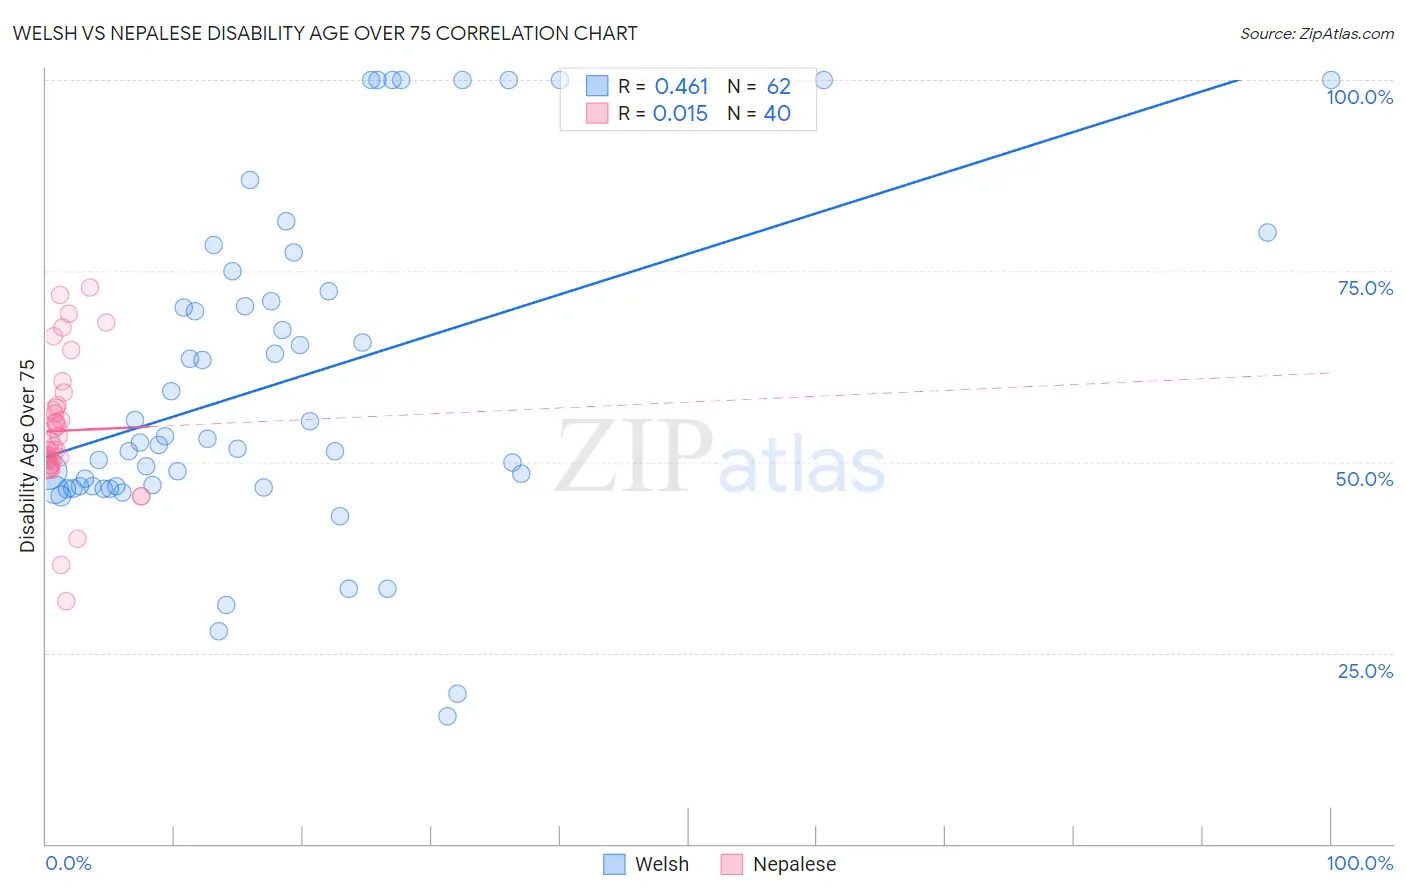
Welsh vs Nepalese Disability Age Over 75 Correlation Chart
The statistical analysis conducted on geographies consisting of 527,126,487 people shows a moderate positive correlation between the proportion of Welsh and percentage of population with a disability over the age of 75 in the United States with a correlation coefficient (R) of 0.461 and weighted average of 47.0%. Similarly, the statistical analysis conducted on geographies consisting of 24,521,755 people shows no correlation between the proportion of Nepalese and percentage of population with a disability over the age of 75 in the United States with a correlation coefficient (R) of 0.015 and weighted average of 52.6%, a difference of 12.0%.
Disability Age Over 75 Correlation Summary
| Measurement | Welsh | Nepalese |
| Minimum | 16.7% | 31.7% |
| Maximum | 100.0% | 72.9% |
| Range | 83.3% | 41.1% |
| Mean | 60.7% | 54.1% |
| Median | 52.8% | 52.3% |
| Interquartile 25% (IQ1) | 46.8% | 49.8% |
| Interquartile 75% (IQ3) | 72.3% | 57.3% |
| Interquartile Range (IQR) | 25.5% | 7.5% |
| Standard Deviation (Sample) | 21.5% | 8.8% |
| Standard Deviation (Population) | 21.3% | 8.7% |
Similar Demographics by Disability Age Over 75
Demographics Similar to Welsh by Disability Age Over 75
In terms of disability age over 75, the demographic groups most similar to Welsh are Asian (46.9%, a difference of 0.010%), Immigrants from Russia (47.0%, a difference of 0.070%), French Canadian (47.0%, a difference of 0.080%), Immigrants from Peru (46.9%, a difference of 0.11%), and Guyanese (46.9%, a difference of 0.12%).
| Demographics | Rating | Rank | Disability Age Over 75 |
| Peruvians | 86.5 /100 | #142 | Excellent 46.8% |
| Bermudans | 85.6 /100 | #143 | Excellent 46.9% |
| Venezuelans | 85.0 /100 | #144 | Excellent 46.9% |
| Costa Ricans | 84.5 /100 | #145 | Excellent 46.9% |
| Guyanese | 84.3 /100 | #146 | Excellent 46.9% |
| Immigrants | Peru | 84.1 /100 | #147 | Excellent 46.9% |
| Asians | 81.6 /100 | #148 | Excellent 46.9% |
| Welsh | 81.3 /100 | #149 | Excellent 47.0% |
| Immigrants | Russia | 79.3 /100 | #150 | Good 47.0% |
| French Canadians | 79.0 /100 | #151 | Good 47.0% |
| Immigrants | Asia | 76.5 /100 | #152 | Good 47.0% |
| Immigrants | Zaire | 74.8 /100 | #153 | Good 47.1% |
| Immigrants | Belarus | 74.8 /100 | #154 | Good 47.1% |
| Immigrants | Iran | 74.7 /100 | #155 | Good 47.1% |
| Arabs | 73.3 /100 | #156 | Good 47.1% |
Demographics Similar to Nepalese by Disability Age Over 75
In terms of disability age over 75, the demographic groups most similar to Nepalese are Ute (52.6%, a difference of 0.030%), Choctaw (52.7%, a difference of 0.19%), Immigrants from Cabo Verde (52.4%, a difference of 0.38%), Alaska Native (52.8%, a difference of 0.41%), and Menominee (52.3%, a difference of 0.54%).
| Demographics | Rating | Rank | Disability Age Over 75 |
| Paiute | 0.0 /100 | #320 | Tragic 51.5% |
| Dutch West Indians | 0.0 /100 | #321 | Tragic 51.5% |
| Comanche | 0.0 /100 | #322 | Tragic 51.7% |
| Immigrants | Yemen | 0.0 /100 | #323 | Tragic 52.0% |
| Menominee | 0.0 /100 | #324 | Tragic 52.3% |
| Immigrants | Cabo Verde | 0.0 /100 | #325 | Tragic 52.4% |
| Ute | 0.0 /100 | #326 | Tragic 52.6% |
| Nepalese | 0.0 /100 | #327 | Tragic 52.6% |
| Choctaw | 0.0 /100 | #328 | Tragic 52.7% |
| Alaska Natives | 0.0 /100 | #329 | Tragic 52.8% |
| Puerto Ricans | 0.0 /100 | #330 | Tragic 52.9% |
| Hopi | 0.0 /100 | #331 | Tragic 52.9% |
| Natives/Alaskans | 0.0 /100 | #332 | Tragic 53.1% |
| Apache | 0.0 /100 | #333 | Tragic 53.6% |
| Alaskan Athabascans | 0.0 /100 | #334 | Tragic 54.0% |