Spanish vs Immigrants from Austria Female Poverty
COMPARE
Spanish
Immigrants from Austria
Female Poverty
Female Poverty Comparison
Spanish
Immigrants from Austria
13.9%
FEMALE POVERTY
21.4/ 100
METRIC RATING
200th/ 347
METRIC RANK
12.0%
FEMALE POVERTY
98.7/ 100
METRIC RATING
53rd/ 347
METRIC RANK
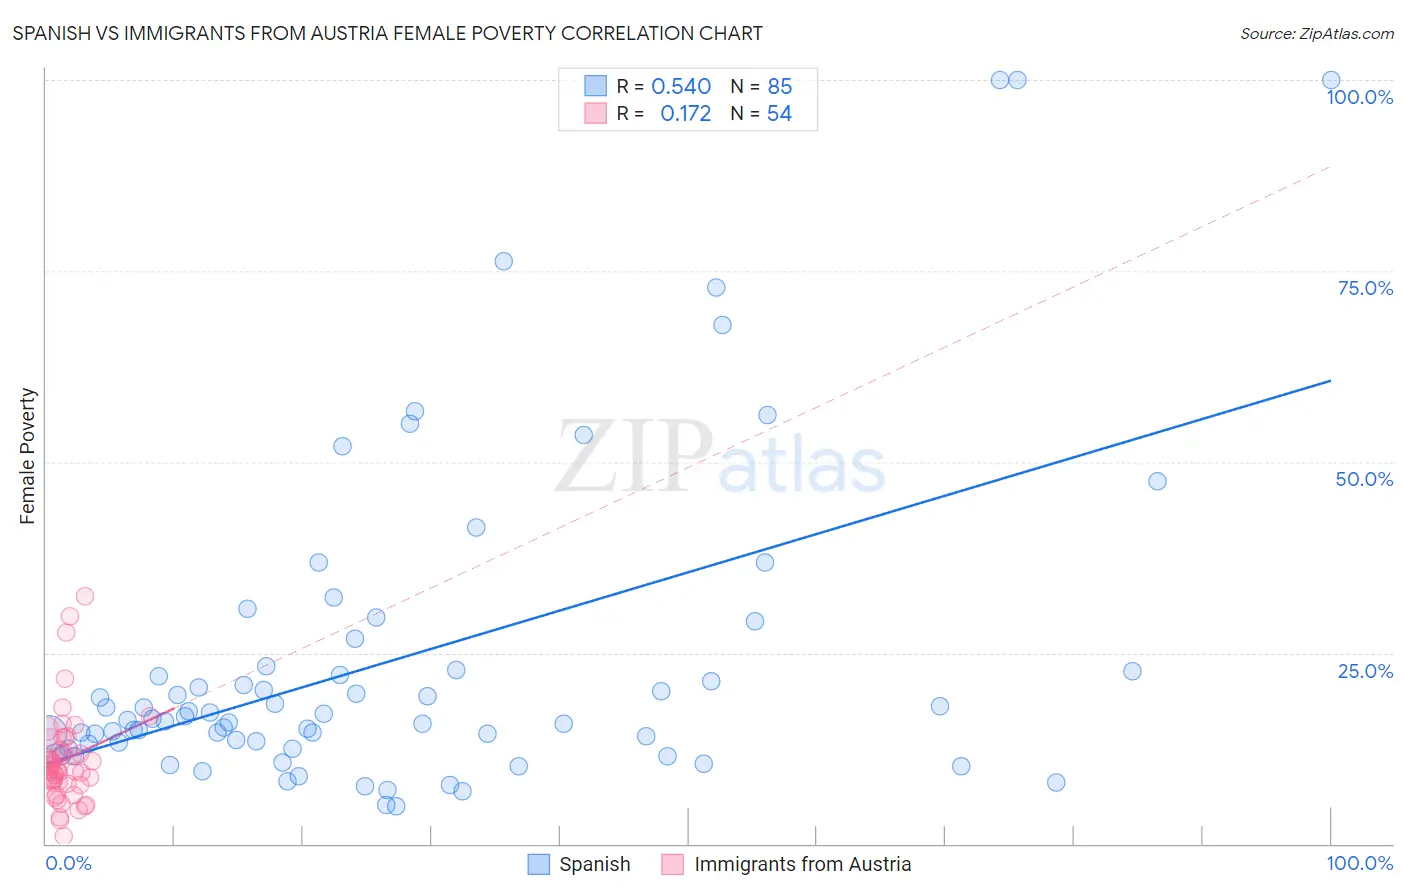
Spanish vs Immigrants from Austria Female Poverty Correlation Chart
The statistical analysis conducted on geographies consisting of 421,834,195 people shows a substantial positive correlation between the proportion of Spanish and poverty level among females in the United States with a correlation coefficient (R) of 0.540 and weighted average of 13.9%. Similarly, the statistical analysis conducted on geographies consisting of 167,923,164 people shows a poor positive correlation between the proportion of Immigrants from Austria and poverty level among females in the United States with a correlation coefficient (R) of 0.172 and weighted average of 12.0%, a difference of 15.2%.
Female Poverty Correlation Summary
| Measurement | Spanish | Immigrants from Austria |
| Minimum | 5.0% | 0.92% |
| Maximum | 100.0% | 32.5% |
| Range | 95.0% | 31.6% |
| Mean | 24.2% | 11.0% |
| Median | 16.3% | 9.6% |
| Interquartile 25% (IQ1) | 12.8% | 8.0% |
| Interquartile 75% (IQ3) | 23.0% | 12.2% |
| Interquartile Range (IQR) | 10.2% | 4.2% |
| Standard Deviation (Sample) | 21.1% | 6.0% |
| Standard Deviation (Population) | 21.0% | 6.0% |
Similar Demographics by Female Poverty
Demographics Similar to Spanish by Female Poverty
In terms of female poverty, the demographic groups most similar to Spanish are Immigrants from Kenya (13.9%, a difference of 0.040%), Hmong (13.9%, a difference of 0.050%), Immigrants from Western Asia (13.9%, a difference of 0.10%), Spaniard (13.9%, a difference of 0.37%), and Immigrants from Lebanon (13.8%, a difference of 0.55%).
| Demographics | Rating | Rank | Female Poverty |
| Iraqis | 31.8 /100 | #193 | Fair 13.7% |
| Delaware | 31.1 /100 | #194 | Fair 13.7% |
| Immigrants | South America | 30.6 /100 | #195 | Fair 13.7% |
| South American Indians | 28.9 /100 | #196 | Fair 13.7% |
| Arabs | 28.6 /100 | #197 | Fair 13.7% |
| Immigrants | Uganda | 28.5 /100 | #198 | Fair 13.7% |
| Immigrants | Lebanon | 25.6 /100 | #199 | Fair 13.8% |
| Spanish | 21.4 /100 | #200 | Fair 13.9% |
| Immigrants | Kenya | 21.1 /100 | #201 | Fair 13.9% |
| Hmong | 21.1 /100 | #202 | Fair 13.9% |
| Immigrants | Western Asia | 20.7 /100 | #203 | Fair 13.9% |
| Spaniards | 18.9 /100 | #204 | Poor 13.9% |
| Ugandans | 15.4 /100 | #205 | Poor 14.0% |
| Immigrants | Uruguay | 14.0 /100 | #206 | Poor 14.0% |
| Immigrants | Eastern Africa | 9.0 /100 | #207 | Tragic 14.2% |
Demographics Similar to Immigrants from Austria by Female Poverty
In terms of female poverty, the demographic groups most similar to Immigrants from Austria are Immigrants from Croatia (12.0%, a difference of 0.010%), Immigrants from Philippines (12.1%, a difference of 0.14%), Immigrants from Bulgaria (12.0%, a difference of 0.31%), Immigrants from Sri Lanka (12.1%, a difference of 0.50%), and Slovene (12.0%, a difference of 0.53%).
| Demographics | Rating | Rank | Female Poverty |
| Turks | 99.2 /100 | #46 | Exceptional 11.9% |
| Asians | 99.1 /100 | #47 | Exceptional 11.9% |
| Immigrants | Japan | 99.0 /100 | #48 | Exceptional 11.9% |
| Immigrants | Romania | 99.0 /100 | #49 | Exceptional 12.0% |
| Slovenes | 98.9 /100 | #50 | Exceptional 12.0% |
| Immigrants | Bulgaria | 98.9 /100 | #51 | Exceptional 12.0% |
| Immigrants | Croatia | 98.7 /100 | #52 | Exceptional 12.0% |
| Immigrants | Austria | 98.7 /100 | #53 | Exceptional 12.0% |
| Immigrants | Philippines | 98.7 /100 | #54 | Exceptional 12.1% |
| Immigrants | Sri Lanka | 98.5 /100 | #55 | Exceptional 12.1% |
| Estonians | 98.3 /100 | #56 | Exceptional 12.1% |
| Immigrants | Serbia | 98.3 /100 | #57 | Exceptional 12.1% |
| Scandinavians | 98.2 /100 | #58 | Exceptional 12.1% |
| Immigrants | Europe | 98.2 /100 | #59 | Exceptional 12.1% |
| Immigrants | Australia | 98.1 /100 | #60 | Exceptional 12.2% |