Welsh vs Immigrants from Austria Median Earnings
COMPARE
Welsh
Immigrants from Austria
Median Earnings
Median Earnings Comparison
Welsh
Immigrants from Austria
$45,710
MEDIAN EARNINGS
26.6/ 100
METRIC RATING
203rd/ 347
METRIC RANK
$51,826
MEDIAN EARNINGS
99.9/ 100
METRIC RATING
51st/ 347
METRIC RANK
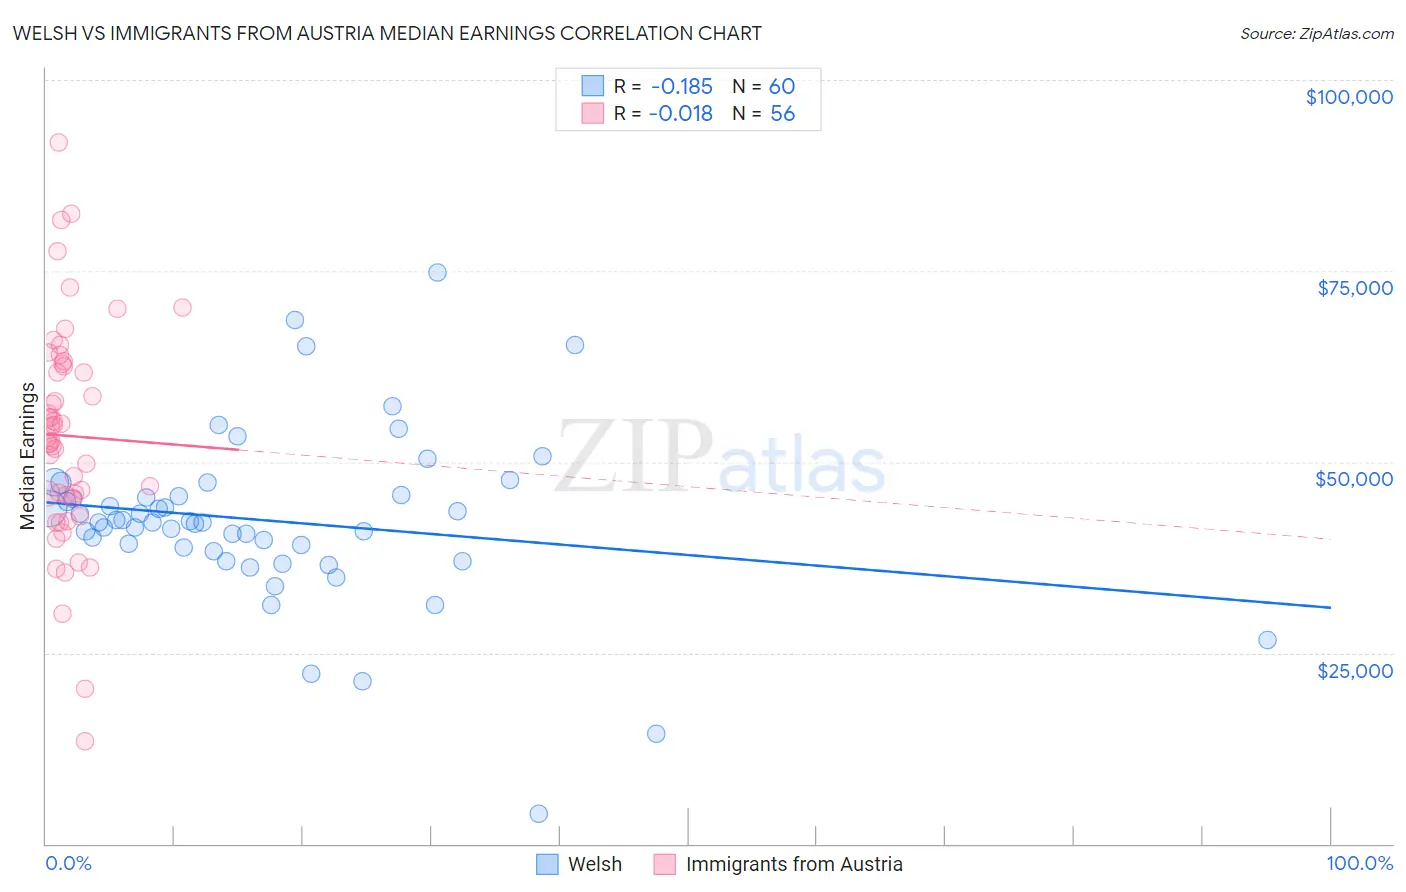
Welsh vs Immigrants from Austria Median Earnings Correlation Chart
The statistical analysis conducted on geographies consisting of 528,402,039 people shows a poor negative correlation between the proportion of Welsh and median earnings in the United States with a correlation coefficient (R) of -0.185 and weighted average of $45,710. Similarly, the statistical analysis conducted on geographies consisting of 167,962,840 people shows no correlation between the proportion of Immigrants from Austria and median earnings in the United States with a correlation coefficient (R) of -0.018 and weighted average of $51,826, a difference of 13.4%.
Median Earnings Correlation Summary
| Measurement | Welsh | Immigrants from Austria |
| Minimum | $3,902 | $13,446 |
| Maximum | $74,844 | $91,775 |
| Range | $70,942 | $78,329 |
| Mean | $42,284 | $53,408 |
| Median | $42,106 | $52,944 |
| Interquartile 25% (IQ1) | $38,560 | $45,427 |
| Interquartile 75% (IQ3) | $45,605 | $62,672 |
| Interquartile Range (IQR) | $7,045 | $17,245 |
| Standard Deviation (Sample) | $11,412 | $14,505 |
| Standard Deviation (Population) | $11,316 | $14,375 |
Similar Demographics by Median Earnings
Demographics Similar to Welsh by Median Earnings
In terms of median earnings, the demographic groups most similar to Welsh are Immigrants from Trinidad and Tobago ($45,729, a difference of 0.040%), Celtic ($45,732, a difference of 0.050%), Immigrants from Uruguay ($45,682, a difference of 0.060%), Tongan ($45,665, a difference of 0.10%), and Immigrants from Ghana ($45,641, a difference of 0.15%).
| Demographics | Rating | Rank | Median Earnings |
| Yugoslavians | 30.5 /100 | #196 | Fair $45,846 |
| Barbadians | 30.5 /100 | #197 | Fair $45,846 |
| Trinidadians and Tobagonians | 29.7 /100 | #198 | Fair $45,820 |
| Immigrants | Barbados | 29.6 /100 | #199 | Fair $45,816 |
| Immigrants | Azores | 29.5 /100 | #200 | Fair $45,812 |
| Celtics | 27.2 /100 | #201 | Fair $45,732 |
| Immigrants | Trinidad and Tobago | 27.1 /100 | #202 | Fair $45,729 |
| Welsh | 26.6 /100 | #203 | Fair $45,710 |
| Immigrants | Uruguay | 25.9 /100 | #204 | Fair $45,682 |
| Tongans | 25.4 /100 | #205 | Fair $45,665 |
| Immigrants | Ghana | 24.8 /100 | #206 | Fair $45,641 |
| Immigrants | Senegal | 24.0 /100 | #207 | Fair $45,611 |
| Immigrants | Bosnia and Herzegovina | 23.7 /100 | #208 | Fair $45,600 |
| Immigrants | Thailand | 23.7 /100 | #209 | Fair $45,598 |
| Immigrants | Grenada | 23.6 /100 | #210 | Fair $45,596 |
Demographics Similar to Immigrants from Austria by Median Earnings
In terms of median earnings, the demographic groups most similar to Immigrants from Austria are Immigrants from South Africa ($51,850, a difference of 0.050%), Estonian ($51,772, a difference of 0.10%), Immigrants from Norway ($51,758, a difference of 0.13%), Immigrants from Indonesia ($51,715, a difference of 0.21%), and Egyptian ($51,701, a difference of 0.24%).
| Demographics | Rating | Rank | Median Earnings |
| Bulgarians | 100.0 /100 | #44 | Exceptional $52,512 |
| Immigrants | Czechoslovakia | 100.0 /100 | #45 | Exceptional $52,361 |
| Bhutanese | 100.0 /100 | #46 | Exceptional $52,297 |
| Australians | 100.0 /100 | #47 | Exceptional $52,294 |
| Immigrants | Europe | 100.0 /100 | #48 | Exceptional $52,195 |
| Bolivians | 100.0 /100 | #49 | Exceptional $52,005 |
| Immigrants | South Africa | 100.0 /100 | #50 | Exceptional $51,850 |
| Immigrants | Austria | 99.9 /100 | #51 | Exceptional $51,826 |
| Estonians | 99.9 /100 | #52 | Exceptional $51,772 |
| Immigrants | Norway | 99.9 /100 | #53 | Exceptional $51,758 |
| Immigrants | Indonesia | 99.9 /100 | #54 | Exceptional $51,715 |
| Egyptians | 99.9 /100 | #55 | Exceptional $51,701 |
| Immigrants | Pakistan | 99.9 /100 | #56 | Exceptional $51,693 |
| Immigrants | Eastern Europe | 99.9 /100 | #57 | Exceptional $51,624 |
| Immigrants | Bolivia | 99.9 /100 | #58 | Exceptional $51,605 |