Welsh vs Dominican Female Disability
COMPARE
Welsh
Dominican
Female Disability
Female Disability Comparison
Welsh
Dominicans
13.1%
FEMALE DISABILITY
0.0/ 100
METRIC RATING
282nd/ 347
METRIC RANK
13.5%
FEMALE DISABILITY
0.0/ 100
METRIC RATING
305th/ 347
METRIC RANK
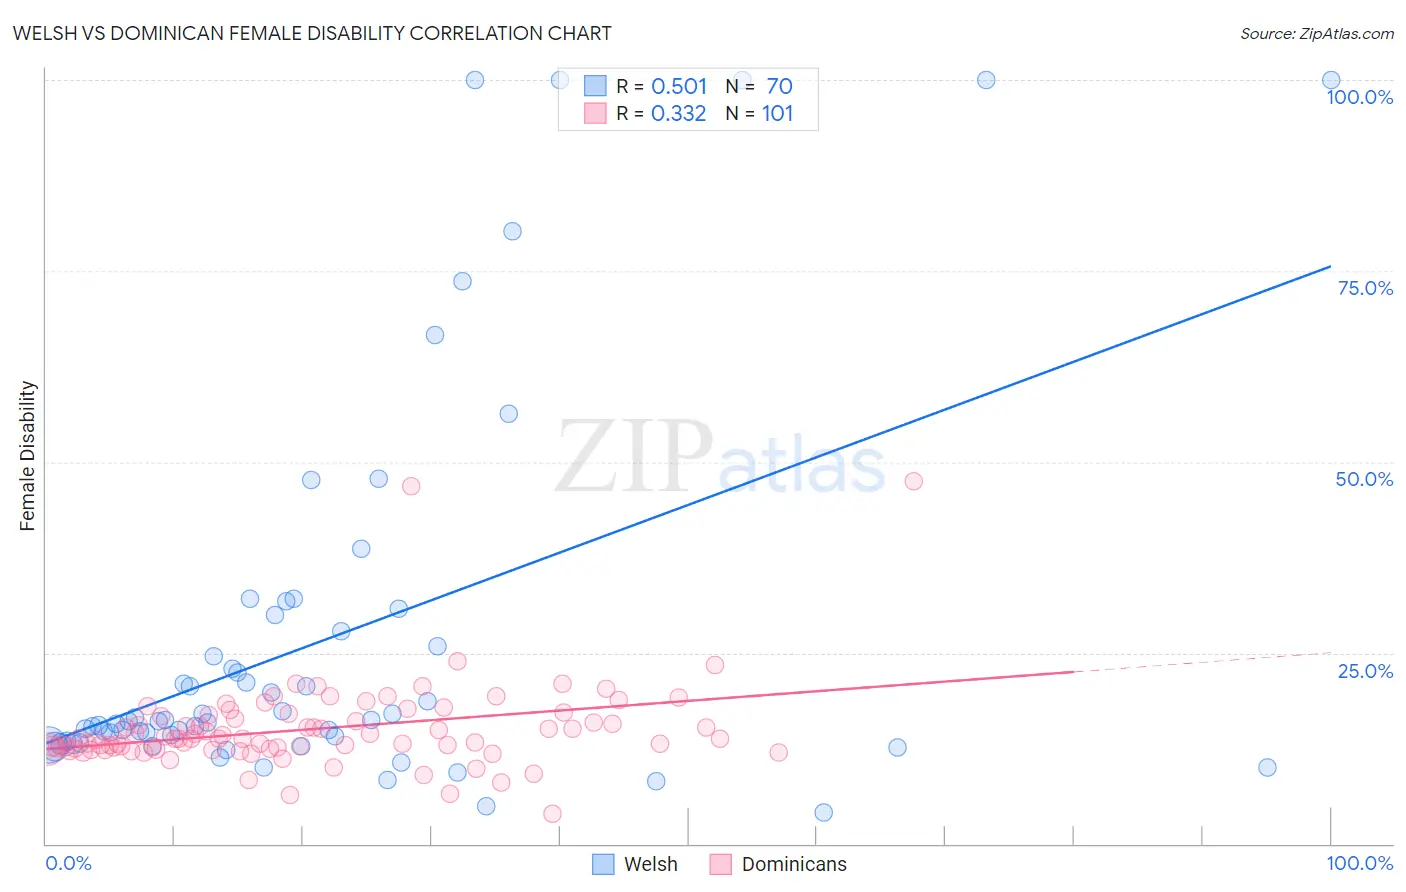
Welsh vs Dominican Female Disability Correlation Chart
The statistical analysis conducted on geographies consisting of 528,453,595 people shows a substantial positive correlation between the proportion of Welsh and percentage of females with a disability in the United States with a correlation coefficient (R) of 0.501 and weighted average of 13.1%. Similarly, the statistical analysis conducted on geographies consisting of 355,036,976 people shows a mild positive correlation between the proportion of Dominicans and percentage of females with a disability in the United States with a correlation coefficient (R) of 0.332 and weighted average of 13.5%, a difference of 3.3%.
Female Disability Correlation Summary
| Measurement | Welsh | Dominican |
| Minimum | 4.2% | 3.9% |
| Maximum | 100.0% | 47.5% |
| Range | 95.8% | 43.7% |
| Mean | 26.8% | 15.0% |
| Median | 16.1% | 13.8% |
| Interquartile 25% (IQ1) | 13.2% | 12.5% |
| Interquartile 75% (IQ3) | 27.8% | 16.7% |
| Interquartile Range (IQR) | 14.7% | 4.2% |
| Standard Deviation (Sample) | 25.2% | 5.8% |
| Standard Deviation (Population) | 25.0% | 5.7% |
Similar Demographics by Female Disability
Demographics Similar to Welsh by Female Disability
In terms of female disability, the demographic groups most similar to Welsh are English (13.1%, a difference of 0.0%), U.S. Virgin Islander (13.1%, a difference of 0.080%), Irish (13.1%, a difference of 0.11%), Hmong (13.1%, a difference of 0.14%), and Bangladeshi (13.1%, a difference of 0.19%).
| Demographics | Rating | Rank | Female Disability |
| Cheyenne | 0.1 /100 | #275 | Tragic 13.0% |
| Immigrants | Dominica | 0.1 /100 | #276 | Tragic 13.0% |
| Spanish | 0.1 /100 | #277 | Tragic 13.0% |
| Scottish | 0.1 /100 | #278 | Tragic 13.0% |
| Arapaho | 0.1 /100 | #279 | Tragic 13.0% |
| Irish | 0.1 /100 | #280 | Tragic 13.1% |
| U.S. Virgin Islanders | 0.1 /100 | #281 | Tragic 13.1% |
| Welsh | 0.0 /100 | #282 | Tragic 13.1% |
| English | 0.0 /100 | #283 | Tragic 13.1% |
| Hmong | 0.0 /100 | #284 | Tragic 13.1% |
| Bangladeshis | 0.0 /100 | #285 | Tragic 13.1% |
| Fijians | 0.0 /100 | #286 | Tragic 13.1% |
| Yaqui | 0.0 /100 | #287 | Tragic 13.2% |
| Whites/Caucasians | 0.0 /100 | #288 | Tragic 13.2% |
| Tlingit-Haida | 0.0 /100 | #289 | Tragic 13.2% |
Demographics Similar to Dominicans by Female Disability
In terms of female disability, the demographic groups most similar to Dominicans are Immigrants from Micronesia (13.5%, a difference of 0.31%), Immigrants from Portugal (13.5%, a difference of 0.34%), Scotch-Irish (13.4%, a difference of 0.35%), African (13.4%, a difference of 0.48%), and French Canadian (13.6%, a difference of 0.63%).
| Demographics | Rating | Rank | Female Disability |
| Immigrants | Nonimmigrants | 0.0 /100 | #298 | Tragic 13.4% |
| Immigrants | Dominican Republic | 0.0 /100 | #299 | Tragic 13.4% |
| Pennsylvania Germans | 0.0 /100 | #300 | Tragic 13.4% |
| Africans | 0.0 /100 | #301 | Tragic 13.4% |
| Scotch-Irish | 0.0 /100 | #302 | Tragic 13.4% |
| Immigrants | Portugal | 0.0 /100 | #303 | Tragic 13.5% |
| Immigrants | Micronesia | 0.0 /100 | #304 | Tragic 13.5% |
| Dominicans | 0.0 /100 | #305 | Tragic 13.5% |
| French Canadians | 0.0 /100 | #306 | Tragic 13.6% |
| Central American Indians | 0.0 /100 | #307 | Tragic 13.6% |
| Cree | 0.0 /100 | #308 | Tragic 13.7% |
| French American Indians | 0.0 /100 | #309 | Tragic 13.7% |
| Apache | 0.0 /100 | #310 | Tragic 13.7% |
| Hopi | 0.0 /100 | #311 | Tragic 13.7% |
| Delaware | 0.0 /100 | #312 | Tragic 13.8% |