Welsh vs Dominican Cognitive Disability
COMPARE
Welsh
Dominican
Cognitive Disability
Cognitive Disability Comparison
Welsh
Dominicans
17.0%
COGNITIVE DISABILITY
90.8/ 100
METRIC RATING
138th/ 347
METRIC RANK
18.7%
COGNITIVE DISABILITY
0.0/ 100
METRIC RATING
324th/ 347
METRIC RANK
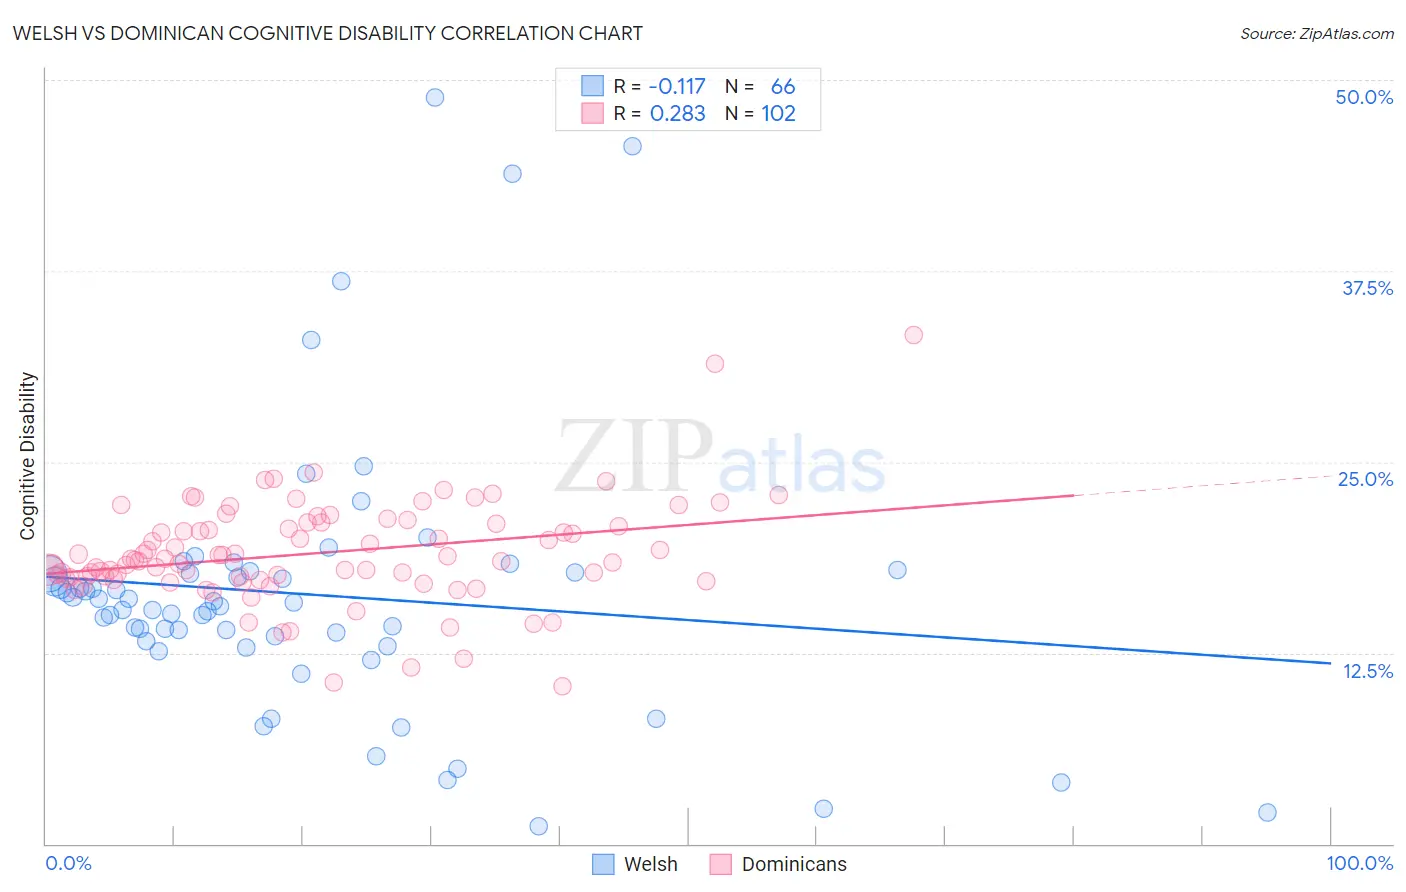
Welsh vs Dominican Cognitive Disability Correlation Chart
The statistical analysis conducted on geographies consisting of 528,521,772 people shows a poor negative correlation between the proportion of Welsh and percentage of population with cognitive disability in the United States with a correlation coefficient (R) of -0.117 and weighted average of 17.0%. Similarly, the statistical analysis conducted on geographies consisting of 355,056,669 people shows a weak positive correlation between the proportion of Dominicans and percentage of population with cognitive disability in the United States with a correlation coefficient (R) of 0.283 and weighted average of 18.7%, a difference of 9.9%.
Cognitive Disability Correlation Summary
| Measurement | Welsh | Dominican |
| Minimum | 1.2% | 10.3% |
| Maximum | 48.8% | 33.3% |
| Range | 47.7% | 23.0% |
| Mean | 16.3% | 19.0% |
| Median | 15.7% | 18.6% |
| Interquartile 25% (IQ1) | 13.2% | 17.4% |
| Interquartile 75% (IQ3) | 17.8% | 21.0% |
| Interquartile Range (IQR) | 4.5% | 3.6% |
| Standard Deviation (Sample) | 8.9% | 3.4% |
| Standard Deviation (Population) | 8.9% | 3.4% |
Similar Demographics by Cognitive Disability
Demographics Similar to Welsh by Cognitive Disability
In terms of cognitive disability, the demographic groups most similar to Welsh are Israeli (17.0%, a difference of 0.020%), Immigrants from Norway (17.0%, a difference of 0.020%), Lebanese (17.0%, a difference of 0.050%), French (17.0%, a difference of 0.070%), and Chilean (17.0%, a difference of 0.070%).
| Demographics | Rating | Rank | Cognitive Disability |
| Immigrants | Germany | 92.1 /100 | #131 | Exceptional 17.0% |
| Whites/Caucasians | 92.1 /100 | #132 | Exceptional 17.0% |
| Immigrants | Jordan | 91.9 /100 | #133 | Exceptional 17.0% |
| Immigrants | Chile | 91.7 /100 | #134 | Exceptional 17.0% |
| Lebanese | 91.3 /100 | #135 | Exceptional 17.0% |
| Israelis | 91.0 /100 | #136 | Exceptional 17.0% |
| Immigrants | Norway | 90.9 /100 | #137 | Exceptional 17.0% |
| Welsh | 90.8 /100 | #138 | Exceptional 17.0% |
| French | 90.0 /100 | #139 | Excellent 17.0% |
| Chileans | 89.9 /100 | #140 | Excellent 17.0% |
| Aleuts | 89.9 /100 | #141 | Excellent 17.0% |
| Carpatho Rusyns | 89.6 /100 | #142 | Excellent 17.0% |
| British | 89.3 /100 | #143 | Excellent 17.0% |
| Immigrants | Brazil | 89.3 /100 | #144 | Excellent 17.0% |
| Immigrants | South Eastern Asia | 88.7 /100 | #145 | Excellent 17.0% |
Demographics Similar to Dominicans by Cognitive Disability
In terms of cognitive disability, the demographic groups most similar to Dominicans are Indonesian (18.7%, a difference of 0.080%), Immigrants from Senegal (18.7%, a difference of 0.10%), Pueblo (18.7%, a difference of 0.12%), Immigrants from Liberia (18.7%, a difference of 0.14%), and U.S. Virgin Islander (18.7%, a difference of 0.14%).
| Demographics | Rating | Rank | Cognitive Disability |
| Liberians | 0.0 /100 | #317 | Tragic 18.6% |
| Bangladeshis | 0.0 /100 | #318 | Tragic 18.6% |
| Comanche | 0.0 /100 | #319 | Tragic 18.6% |
| Apache | 0.0 /100 | #320 | Tragic 18.6% |
| Africans | 0.0 /100 | #321 | Tragic 18.6% |
| Immigrants | Liberia | 0.0 /100 | #322 | Tragic 18.7% |
| Pueblo | 0.0 /100 | #323 | Tragic 18.7% |
| Dominicans | 0.0 /100 | #324 | Tragic 18.7% |
| Indonesians | 0.0 /100 | #325 | Tragic 18.7% |
| Immigrants | Senegal | 0.0 /100 | #326 | Tragic 18.7% |
| U.S. Virgin Islanders | 0.0 /100 | #327 | Tragic 18.7% |
| Kiowa | 0.0 /100 | #328 | Tragic 18.7% |
| Navajo | 0.0 /100 | #329 | Tragic 18.8% |
| Immigrants | Dominican Republic | 0.0 /100 | #330 | Tragic 18.8% |
| Pima | 0.0 /100 | #331 | Tragic 18.8% |