Immigrants from West Indies vs Dominican Single Male Poverty
COMPARE
Immigrants from West Indies
Dominican
Single Male Poverty
Single Male Poverty Comparison
Immigrants from West Indies
Dominicans
12.9%
SINGLE MALE POVERTY
33.0/ 100
METRIC RATING
183rd/ 347
METRIC RANK
15.2%
SINGLE MALE POVERTY
0.0/ 100
METRIC RATING
301st/ 347
METRIC RANK
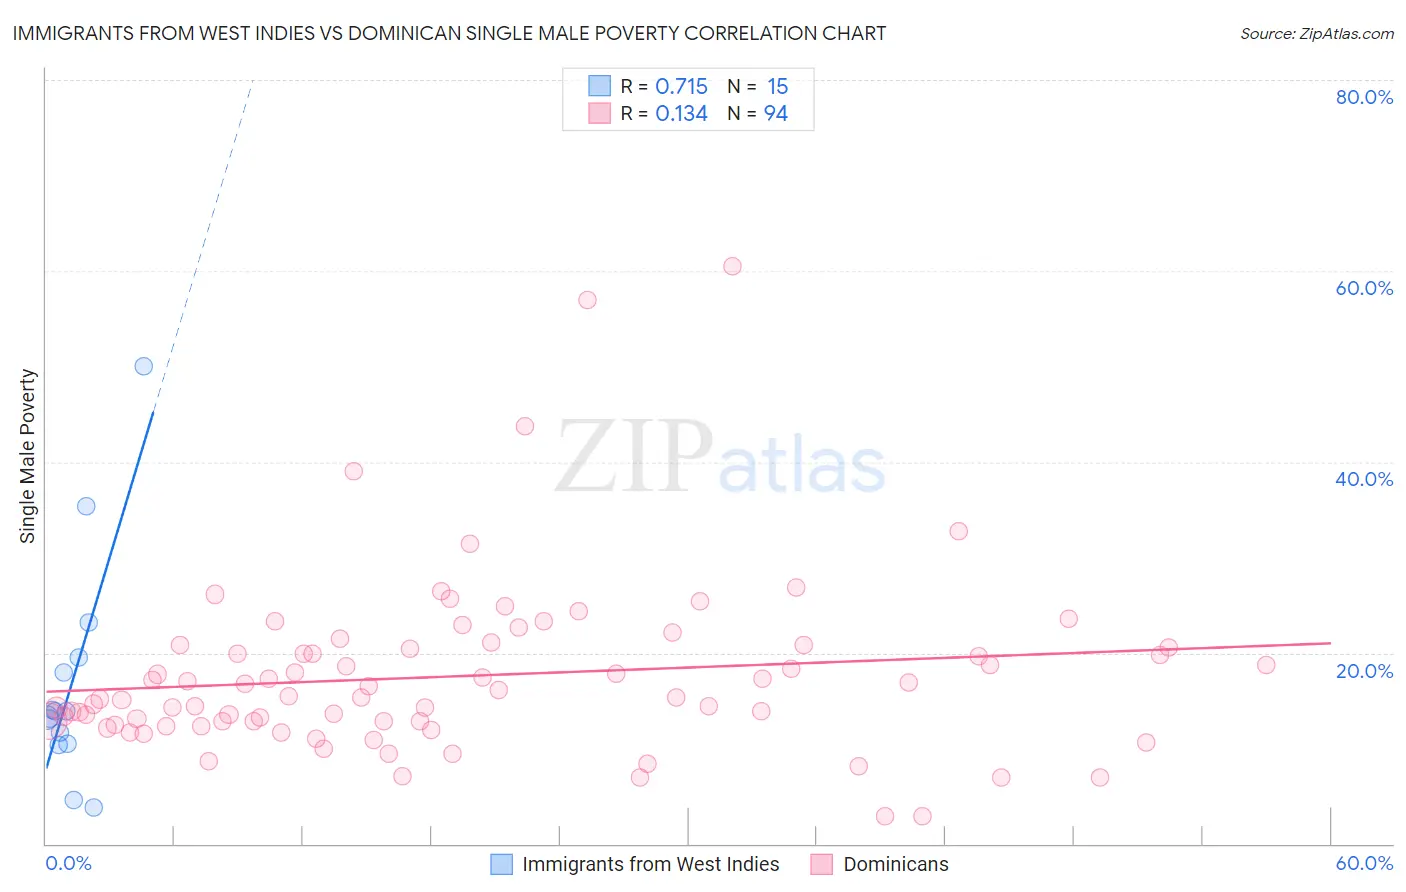
Immigrants from West Indies vs Dominican Single Male Poverty Correlation Chart
The statistical analysis conducted on geographies consisting of 70,729,922 people shows a strong positive correlation between the proportion of Immigrants from West Indies and poverty level among single males in the United States with a correlation coefficient (R) of 0.715 and weighted average of 12.9%. Similarly, the statistical analysis conducted on geographies consisting of 318,233,165 people shows a poor positive correlation between the proportion of Dominicans and poverty level among single males in the United States with a correlation coefficient (R) of 0.134 and weighted average of 15.2%, a difference of 17.8%.
Single Male Poverty Correlation Summary
| Measurement | Immigrants from West Indies | Dominican |
| Minimum | 3.8% | 2.9% |
| Maximum | 50.0% | 60.5% |
| Range | 46.2% | 57.6% |
| Mean | 17.0% | 17.6% |
| Median | 13.8% | 15.4% |
| Interquartile 25% (IQ1) | 10.5% | 12.8% |
| Interquartile 75% (IQ3) | 19.5% | 20.6% |
| Interquartile Range (IQR) | 9.0% | 7.8% |
| Standard Deviation (Sample) | 11.9% | 9.1% |
| Standard Deviation (Population) | 11.5% | 9.1% |
Similar Demographics by Single Male Poverty
Demographics Similar to Immigrants from West Indies by Single Male Poverty
In terms of single male poverty, the demographic groups most similar to Immigrants from West Indies are Immigrants from Trinidad and Tobago (12.9%, a difference of 0.030%), Norwegian (12.9%, a difference of 0.060%), Nigerian (12.9%, a difference of 0.060%), Immigrants from Kuwait (12.9%, a difference of 0.060%), and Macedonian (12.9%, a difference of 0.090%).
| Demographics | Rating | Rank | Single Male Poverty |
| Syrians | 48.4 /100 | #176 | Average 12.8% |
| Immigrants | Canada | 44.8 /100 | #177 | Average 12.8% |
| Immigrants | Switzerland | 43.1 /100 | #178 | Average 12.8% |
| Israelis | 41.0 /100 | #179 | Average 12.9% |
| Immigrants | North America | 37.7 /100 | #180 | Fair 12.9% |
| Panamanians | 37.6 /100 | #181 | Fair 12.9% |
| Moroccans | 36.8 /100 | #182 | Fair 12.9% |
| Immigrants | West Indies | 33.0 /100 | #183 | Fair 12.9% |
| Immigrants | Trinidad and Tobago | 32.5 /100 | #184 | Fair 12.9% |
| Norwegians | 32.0 /100 | #185 | Fair 12.9% |
| Nigerians | 31.9 /100 | #186 | Fair 12.9% |
| Immigrants | Kuwait | 31.9 /100 | #187 | Fair 12.9% |
| Macedonians | 31.5 /100 | #188 | Fair 12.9% |
| Portuguese | 30.2 /100 | #189 | Fair 12.9% |
| Arabs | 27.0 /100 | #190 | Fair 13.0% |
Demographics Similar to Dominicans by Single Male Poverty
In terms of single male poverty, the demographic groups most similar to Dominicans are Alsatian (15.2%, a difference of 0.16%), Cree (15.1%, a difference of 0.82%), Aleut (15.4%, a difference of 1.2%), Delaware (15.0%, a difference of 1.3%), and Alaska Native (15.4%, a difference of 1.3%).
| Demographics | Rating | Rank | Single Male Poverty |
| Ottawa | 0.0 /100 | #294 | Tragic 14.6% |
| Scotch-Irish | 0.0 /100 | #295 | Tragic 14.7% |
| Africans | 0.0 /100 | #296 | Tragic 14.7% |
| Immigrants | Dominican Republic | 0.0 /100 | #297 | Tragic 14.8% |
| French American Indians | 0.0 /100 | #298 | Tragic 15.0% |
| Delaware | 0.0 /100 | #299 | Tragic 15.0% |
| Cree | 0.0 /100 | #300 | Tragic 15.1% |
| Dominicans | 0.0 /100 | #301 | Tragic 15.2% |
| Alsatians | 0.0 /100 | #302 | Tragic 15.2% |
| Aleuts | 0.0 /100 | #303 | Tragic 15.4% |
| Alaska Natives | 0.0 /100 | #304 | Tragic 15.4% |
| Blackfeet | 0.0 /100 | #305 | Tragic 15.5% |
| Pennsylvania Germans | 0.0 /100 | #306 | Tragic 15.6% |
| Ute | 0.0 /100 | #307 | Tragic 15.7% |
| Potawatomi | 0.0 /100 | #308 | Tragic 15.8% |