Panamanian vs Cuban Single Father Poverty
COMPARE
Panamanian
Cuban
Single Father Poverty
Single Father Poverty Comparison
Panamanians
Cubans
16.4%
SINGLE FATHER POVERTY
33.6/ 100
METRIC RATING
185th/ 347
METRIC RANK
16.6%
SINGLE FATHER POVERTY
16.5/ 100
METRIC RATING
201st/ 347
METRIC RANK
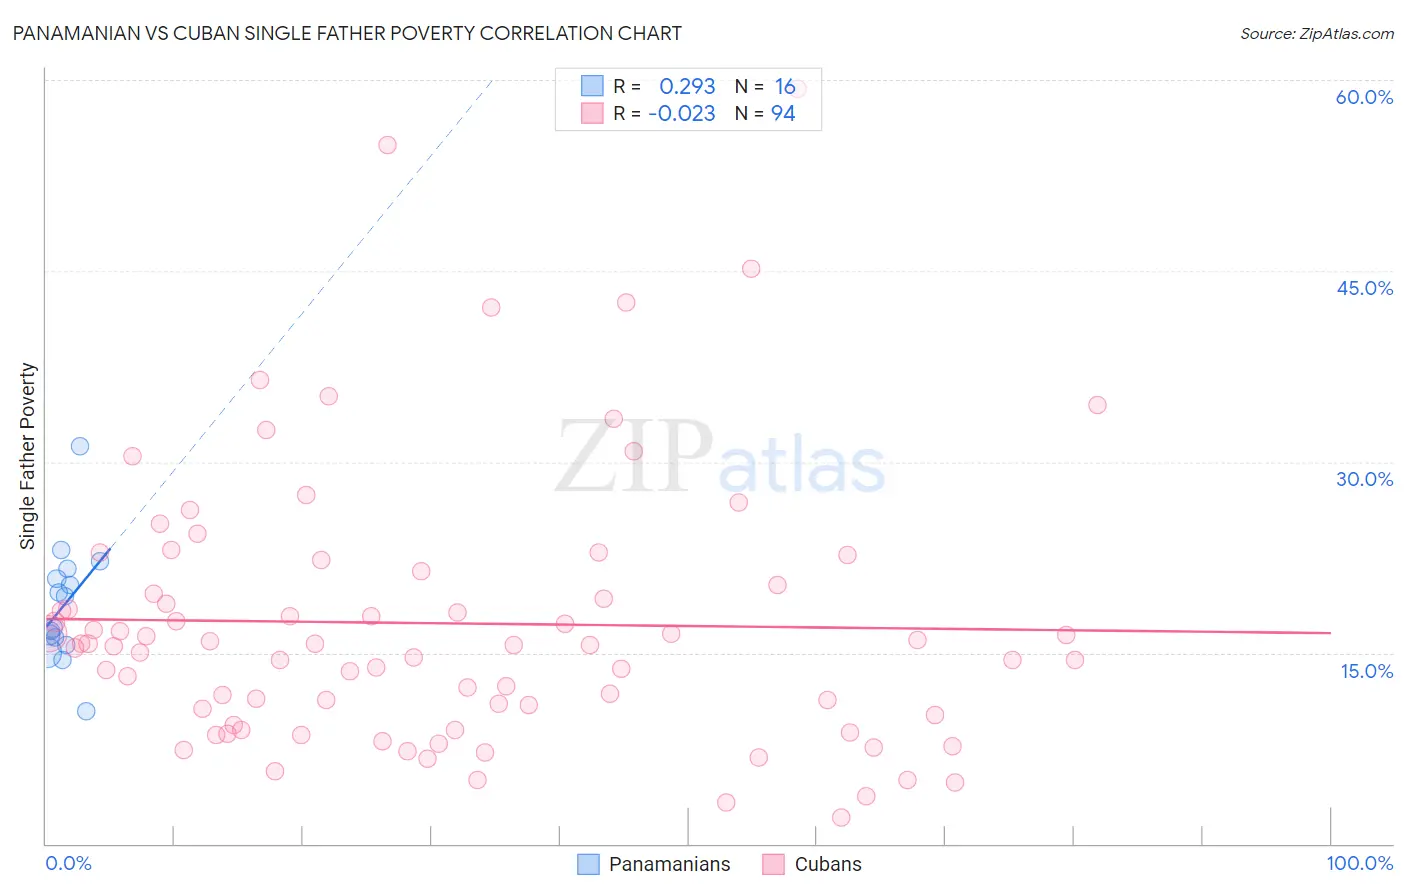
Panamanian vs Cuban Single Father Poverty Correlation Chart
The statistical analysis conducted on geographies consisting of 236,933,167 people shows a weak positive correlation between the proportion of Panamanians and poverty level among single fathers in the United States with a correlation coefficient (R) of 0.293 and weighted average of 16.4%. Similarly, the statistical analysis conducted on geographies consisting of 350,103,033 people shows no correlation between the proportion of Cubans and poverty level among single fathers in the United States with a correlation coefficient (R) of -0.023 and weighted average of 16.6%, a difference of 1.0%.
Single Father Poverty Correlation Summary
| Measurement | Panamanian | Cuban |
| Minimum | 10.4% | 2.1% |
| Maximum | 31.2% | 59.3% |
| Range | 20.8% | 57.2% |
| Mean | 18.8% | 17.3% |
| Median | 18.2% | 15.6% |
| Interquartile 25% (IQ1) | 15.9% | 10.1% |
| Interquartile 75% (IQ3) | 21.2% | 20.3% |
| Interquartile Range (IQR) | 5.3% | 10.2% |
| Standard Deviation (Sample) | 4.7% | 10.7% |
| Standard Deviation (Population) | 4.6% | 10.7% |
Demographics Similar to Panamanians and Cubans by Single Father Poverty
In terms of single father poverty, the demographic groups most similar to Panamanians are Cambodian (16.4%, a difference of 0.050%), Aleut (16.4%, a difference of 0.080%), Immigrants from Venezuela (16.4%, a difference of 0.13%), Ukrainian (16.4%, a difference of 0.16%), and Russian (16.4%, a difference of 0.18%). Similarly, the demographic groups most similar to Cubans are Immigrants from Croatia (16.6%, a difference of 0.0%), Syrian (16.6%, a difference of 0.070%), Immigrants from North America (16.6%, a difference of 0.12%), Immigrants from Belize (16.5%, a difference of 0.24%), and Romanian (16.5%, a difference of 0.26%).
| Demographics | Rating | Rank | Single Father Poverty |
| Aleuts | 35.3 /100 | #183 | Fair 16.4% |
| Cambodians | 34.6 /100 | #184 | Fair 16.4% |
| Panamanians | 33.6 /100 | #185 | Fair 16.4% |
| Immigrants | Venezuela | 31.0 /100 | #186 | Fair 16.4% |
| Ukrainians | 30.4 /100 | #187 | Fair 16.4% |
| Russians | 30.1 /100 | #188 | Fair 16.4% |
| Latvians | 28.9 /100 | #189 | Fair 16.5% |
| Immigrants | Burma/Myanmar | 28.0 /100 | #190 | Fair 16.5% |
| Immigrants | Guyana | 27.1 /100 | #191 | Fair 16.5% |
| Immigrants | Switzerland | 24.8 /100 | #192 | Fair 16.5% |
| Ecuadorians | 24.5 /100 | #193 | Fair 16.5% |
| Cape Verdeans | 24.4 /100 | #194 | Fair 16.5% |
| Immigrants | Barbados | 24.3 /100 | #195 | Fair 16.5% |
| Immigrants | Canada | 21.9 /100 | #196 | Fair 16.5% |
| Immigrants | Northern Europe | 20.3 /100 | #197 | Fair 16.5% |
| Romanians | 20.1 /100 | #198 | Fair 16.5% |
| Immigrants | Belize | 19.8 /100 | #199 | Poor 16.5% |
| Syrians | 17.4 /100 | #200 | Poor 16.6% |
| Cubans | 16.5 /100 | #201 | Poor 16.6% |
| Immigrants | Croatia | 16.5 /100 | #202 | Poor 16.6% |
| Immigrants | North America | 15.1 /100 | #203 | Poor 16.6% |