Polish vs Cuban Single Father Poverty
COMPARE
Polish
Cuban
Single Father Poverty
Single Father Poverty Comparison
Poles
Cubans
17.3%
SINGLE FATHER POVERTY
0.3/ 100
METRIC RATING
265th/ 347
METRIC RANK
16.6%
SINGLE FATHER POVERTY
16.5/ 100
METRIC RATING
201st/ 347
METRIC RANK
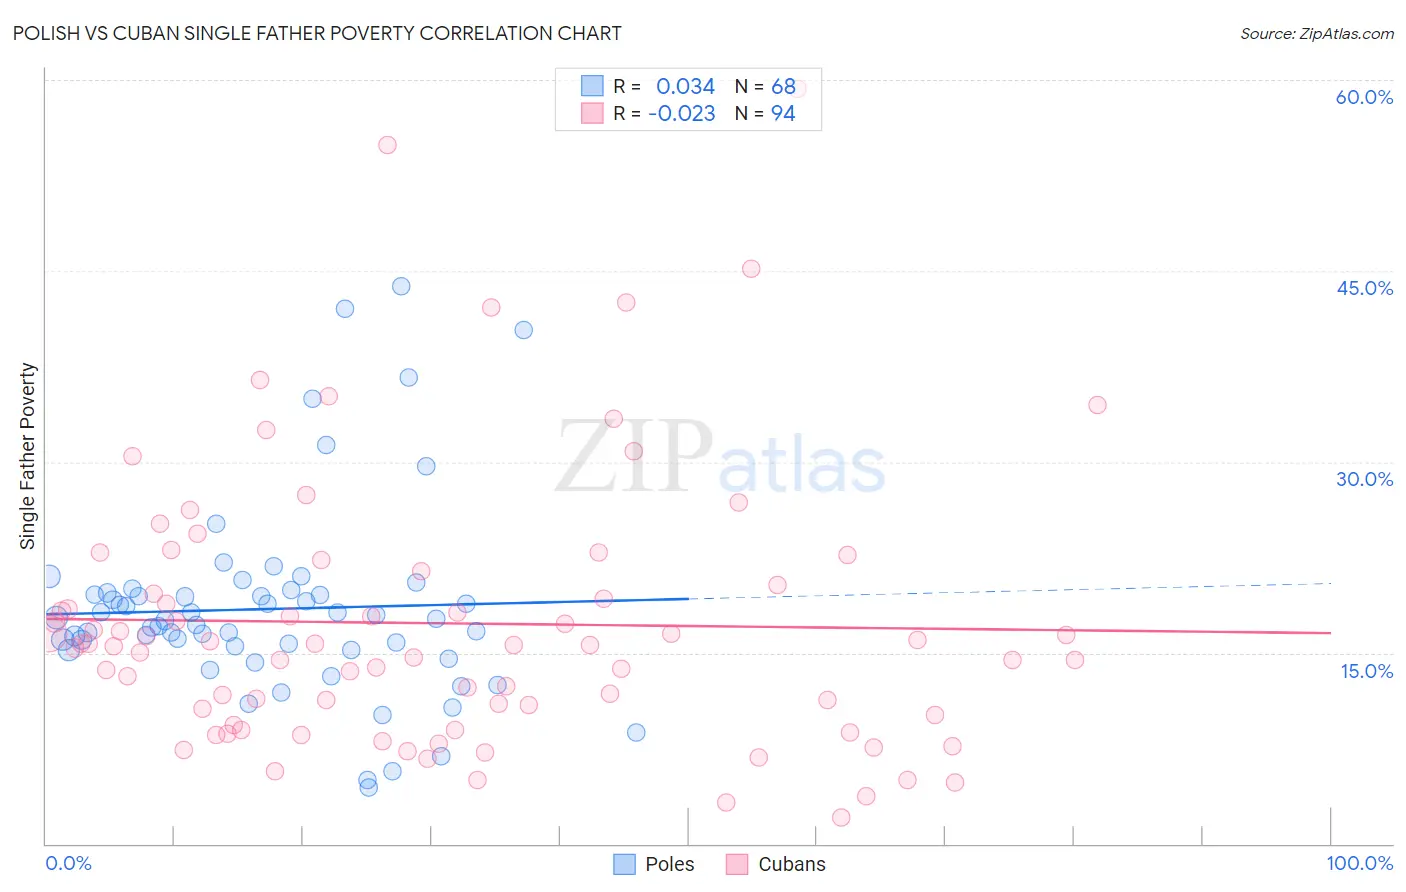
Polish vs Cuban Single Father Poverty Correlation Chart
The statistical analysis conducted on geographies consisting of 402,702,262 people shows no correlation between the proportion of Poles and poverty level among single fathers in the United States with a correlation coefficient (R) of 0.034 and weighted average of 17.3%. Similarly, the statistical analysis conducted on geographies consisting of 350,103,033 people shows no correlation between the proportion of Cubans and poverty level among single fathers in the United States with a correlation coefficient (R) of -0.023 and weighted average of 16.6%, a difference of 4.4%.
Single Father Poverty Correlation Summary
| Measurement | Polish | Cuban |
| Minimum | 4.5% | 2.1% |
| Maximum | 43.8% | 59.3% |
| Range | 39.4% | 57.2% |
| Mean | 18.4% | 17.3% |
| Median | 17.6% | 15.6% |
| Interquartile 25% (IQ1) | 15.4% | 10.1% |
| Interquartile 75% (IQ3) | 19.6% | 20.3% |
| Interquartile Range (IQR) | 4.2% | 10.2% |
| Standard Deviation (Sample) | 7.7% | 10.7% |
| Standard Deviation (Population) | 7.6% | 10.7% |
Similar Demographics by Single Father Poverty
Demographics Similar to Poles by Single Father Poverty
In terms of single father poverty, the demographic groups most similar to Poles are Slovene (17.3%, a difference of 0.0%), Jamaican (17.3%, a difference of 0.060%), Haitian (17.3%, a difference of 0.090%), Immigrants from Caribbean (17.4%, a difference of 0.19%), and Lithuanian (17.3%, a difference of 0.21%).
| Demographics | Rating | Rank | Single Father Poverty |
| Albanians | 0.7 /100 | #258 | Tragic 17.2% |
| Immigrants | Jamaica | 0.7 /100 | #259 | Tragic 17.2% |
| Spaniards | 0.6 /100 | #260 | Tragic 17.2% |
| Swiss | 0.5 /100 | #261 | Tragic 17.3% |
| Immigrants | Zaire | 0.4 /100 | #262 | Tragic 17.3% |
| Lithuanians | 0.4 /100 | #263 | Tragic 17.3% |
| Slovenes | 0.3 /100 | #264 | Tragic 17.3% |
| Poles | 0.3 /100 | #265 | Tragic 17.3% |
| Jamaicans | 0.3 /100 | #266 | Tragic 17.3% |
| Haitians | 0.3 /100 | #267 | Tragic 17.3% |
| Immigrants | Caribbean | 0.3 /100 | #268 | Tragic 17.4% |
| Slavs | 0.3 /100 | #269 | Tragic 17.4% |
| Indonesians | 0.2 /100 | #270 | Tragic 17.4% |
| French American Indians | 0.2 /100 | #271 | Tragic 17.4% |
| Barbadians | 0.1 /100 | #272 | Tragic 17.5% |
Demographics Similar to Cubans by Single Father Poverty
In terms of single father poverty, the demographic groups most similar to Cubans are Immigrants from Croatia (16.6%, a difference of 0.0%), Syrian (16.6%, a difference of 0.070%), Immigrants from North America (16.6%, a difference of 0.12%), Immigrants from Guatemala (16.6%, a difference of 0.15%), and Venezuelan (16.6%, a difference of 0.19%).
| Demographics | Rating | Rank | Single Father Poverty |
| Cape Verdeans | 24.4 /100 | #194 | Fair 16.5% |
| Immigrants | Barbados | 24.3 /100 | #195 | Fair 16.5% |
| Immigrants | Canada | 21.9 /100 | #196 | Fair 16.5% |
| Immigrants | Northern Europe | 20.3 /100 | #197 | Fair 16.5% |
| Romanians | 20.1 /100 | #198 | Fair 16.5% |
| Immigrants | Belize | 19.8 /100 | #199 | Poor 16.5% |
| Syrians | 17.4 /100 | #200 | Poor 16.6% |
| Cubans | 16.5 /100 | #201 | Poor 16.6% |
| Immigrants | Croatia | 16.5 /100 | #202 | Poor 16.6% |
| Immigrants | North America | 15.1 /100 | #203 | Poor 16.6% |
| Immigrants | Guatemala | 14.8 /100 | #204 | Poor 16.6% |
| Venezuelans | 14.3 /100 | #205 | Poor 16.6% |
| Immigrants | Senegal | 13.7 /100 | #206 | Poor 16.6% |
| New Zealanders | 13.7 /100 | #207 | Poor 16.6% |
| Eastern Europeans | 13.7 /100 | #208 | Poor 16.6% |