Immigrants from Western Africa vs Cuban Single Father Poverty
COMPARE
Immigrants from Western Africa
Cuban
Single Father Poverty
Single Father Poverty Comparison
Immigrants from Western Africa
Cubans
16.4%
SINGLE FATHER POVERTY
36.0/ 100
METRIC RATING
181st/ 347
METRIC RANK
16.6%
SINGLE FATHER POVERTY
16.5/ 100
METRIC RATING
201st/ 347
METRIC RANK
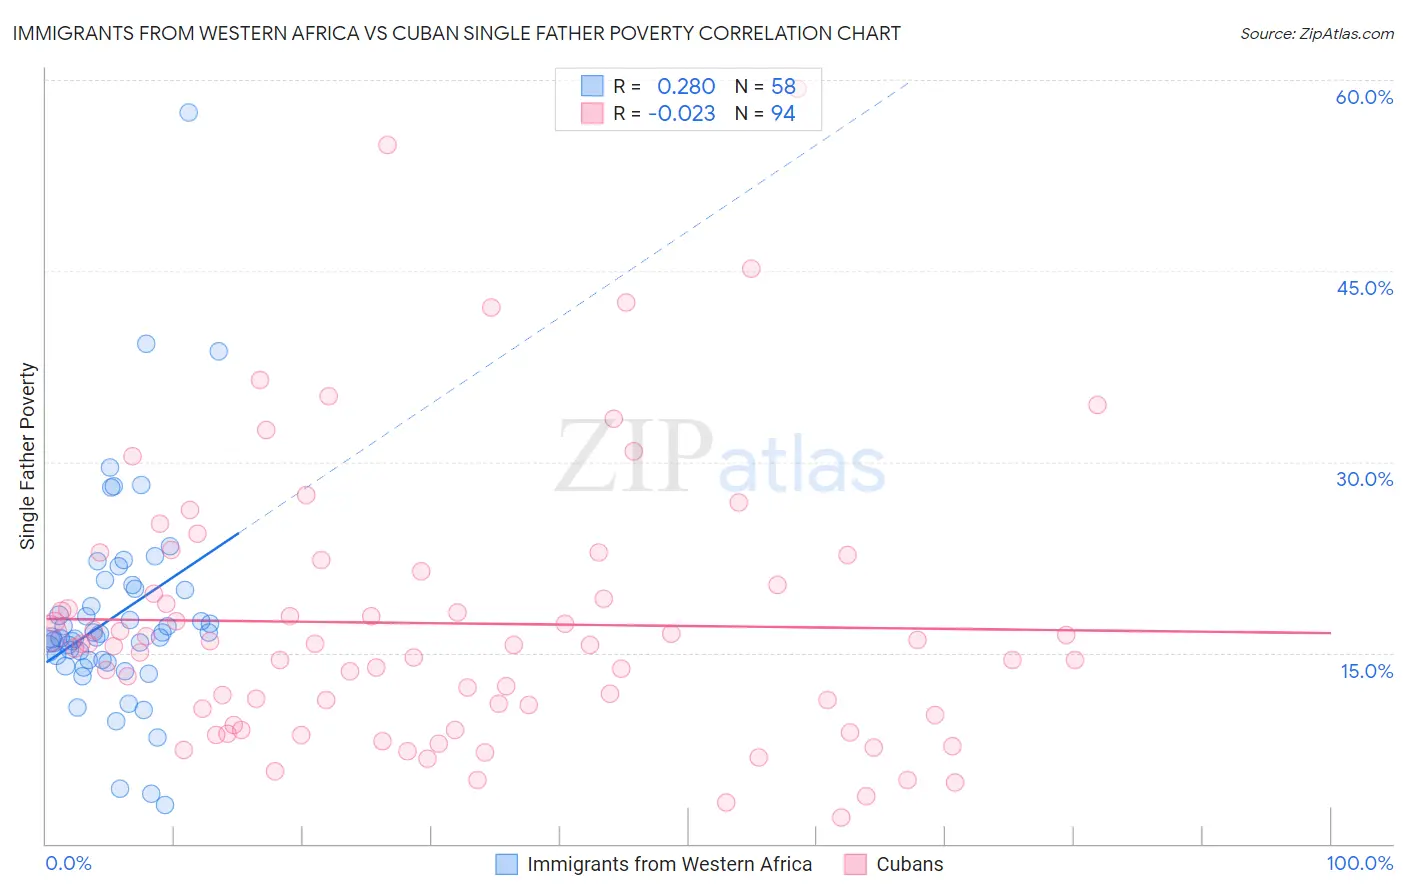
Immigrants from Western Africa vs Cuban Single Father Poverty Correlation Chart
The statistical analysis conducted on geographies consisting of 289,916,705 people shows a weak positive correlation between the proportion of Immigrants from Western Africa and poverty level among single fathers in the United States with a correlation coefficient (R) of 0.280 and weighted average of 16.4%. Similarly, the statistical analysis conducted on geographies consisting of 350,103,033 people shows no correlation between the proportion of Cubans and poverty level among single fathers in the United States with a correlation coefficient (R) of -0.023 and weighted average of 16.6%, a difference of 1.1%.
Single Father Poverty Correlation Summary
| Measurement | Immigrants from Western Africa | Cuban |
| Minimum | 3.1% | 2.1% |
| Maximum | 57.4% | 59.3% |
| Range | 54.4% | 57.2% |
| Mean | 18.0% | 17.3% |
| Median | 16.2% | 15.6% |
| Interquartile 25% (IQ1) | 14.4% | 10.1% |
| Interquartile 75% (IQ3) | 20.0% | 20.3% |
| Interquartile Range (IQR) | 5.5% | 10.2% |
| Standard Deviation (Sample) | 8.5% | 10.7% |
| Standard Deviation (Population) | 8.5% | 10.7% |
Demographics Similar to Immigrants from Western Africa and Cubans by Single Father Poverty
In terms of single father poverty, the demographic groups most similar to Immigrants from Western Africa are Immigrants from Italy (16.4%, a difference of 0.010%), Aleut (16.4%, a difference of 0.030%), Cambodian (16.4%, a difference of 0.060%), Panamanian (16.4%, a difference of 0.12%), and Immigrants from Venezuela (16.4%, a difference of 0.24%). Similarly, the demographic groups most similar to Cubans are Syrian (16.6%, a difference of 0.070%), Immigrants from Belize (16.5%, a difference of 0.24%), Romanian (16.5%, a difference of 0.26%), Immigrants from Northern Europe (16.5%, a difference of 0.27%), and Immigrants from Canada (16.5%, a difference of 0.38%).
| Demographics | Rating | Rank | Single Father Poverty |
| Immigrants | Western Africa | 36.0 /100 | #181 | Fair 16.4% |
| Immigrants | Italy | 35.7 /100 | #182 | Fair 16.4% |
| Aleuts | 35.3 /100 | #183 | Fair 16.4% |
| Cambodians | 34.6 /100 | #184 | Fair 16.4% |
| Panamanians | 33.6 /100 | #185 | Fair 16.4% |
| Immigrants | Venezuela | 31.0 /100 | #186 | Fair 16.4% |
| Ukrainians | 30.4 /100 | #187 | Fair 16.4% |
| Russians | 30.1 /100 | #188 | Fair 16.4% |
| Latvians | 28.9 /100 | #189 | Fair 16.5% |
| Immigrants | Burma/Myanmar | 28.0 /100 | #190 | Fair 16.5% |
| Immigrants | Guyana | 27.1 /100 | #191 | Fair 16.5% |
| Immigrants | Switzerland | 24.8 /100 | #192 | Fair 16.5% |
| Ecuadorians | 24.5 /100 | #193 | Fair 16.5% |
| Cape Verdeans | 24.4 /100 | #194 | Fair 16.5% |
| Immigrants | Barbados | 24.3 /100 | #195 | Fair 16.5% |
| Immigrants | Canada | 21.9 /100 | #196 | Fair 16.5% |
| Immigrants | Northern Europe | 20.3 /100 | #197 | Fair 16.5% |
| Romanians | 20.1 /100 | #198 | Fair 16.5% |
| Immigrants | Belize | 19.8 /100 | #199 | Poor 16.5% |
| Syrians | 17.4 /100 | #200 | Poor 16.6% |
| Cubans | 16.5 /100 | #201 | Poor 16.6% |