Vietnamese vs Immigrants from Romania Single Mother Poverty
COMPARE
Vietnamese
Immigrants from Romania
Single Mother Poverty
Single Mother Poverty Comparison
Vietnamese
Immigrants from Romania
30.9%
SINGLE MOTHER POVERTY
0.7/ 100
METRIC RATING
250th/ 347
METRIC RANK
27.2%
SINGLE MOTHER POVERTY
99.7/ 100
METRIC RATING
56th/ 347
METRIC RANK
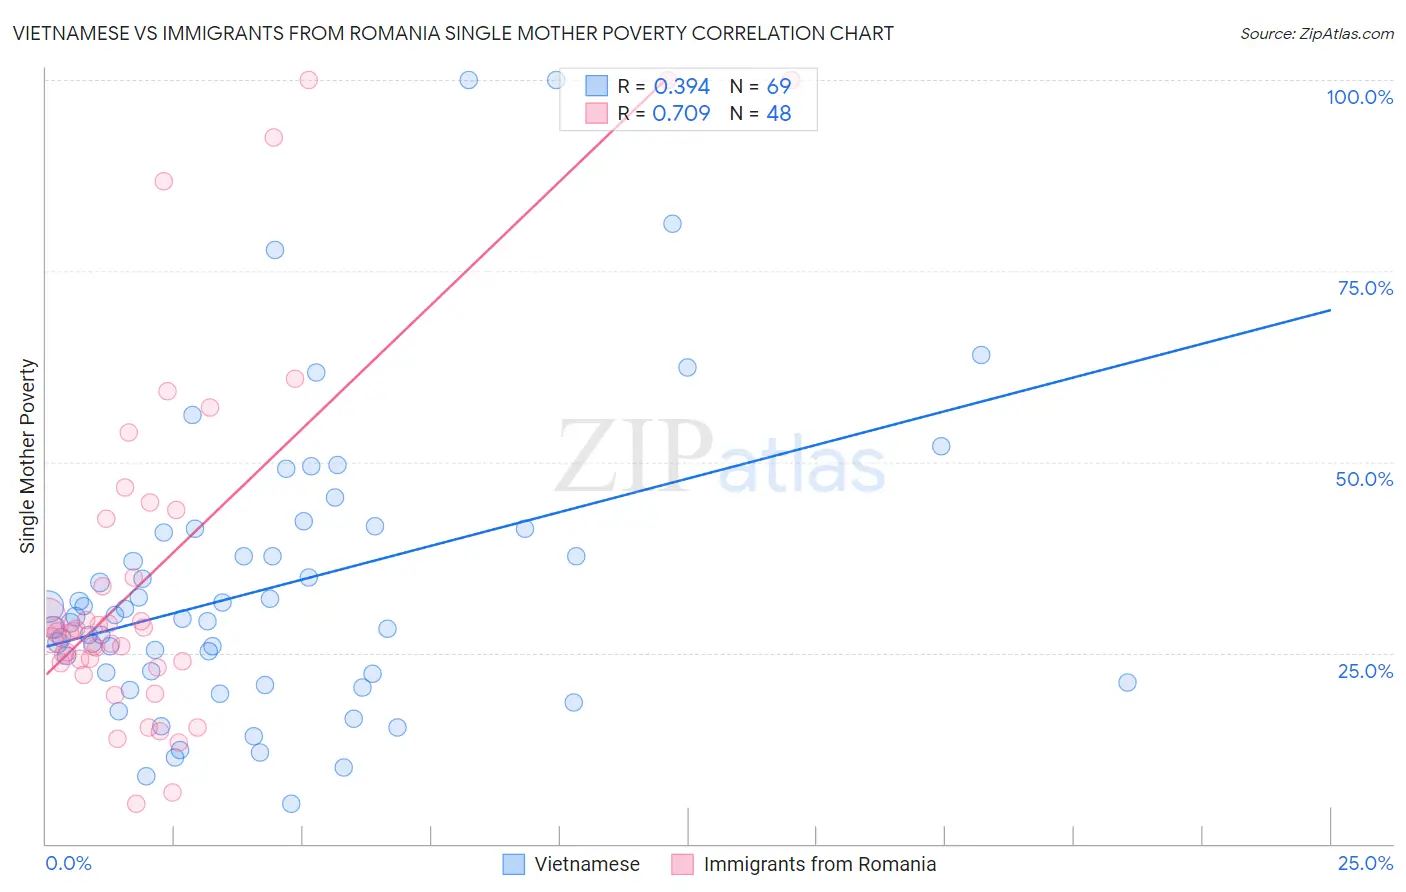
Vietnamese vs Immigrants from Romania Single Mother Poverty Correlation Chart
The statistical analysis conducted on geographies consisting of 168,932,056 people shows a mild positive correlation between the proportion of Vietnamese and poverty level among single mothers in the United States with a correlation coefficient (R) of 0.394 and weighted average of 30.9%. Similarly, the statistical analysis conducted on geographies consisting of 252,141,332 people shows a strong positive correlation between the proportion of Immigrants from Romania and poverty level among single mothers in the United States with a correlation coefficient (R) of 0.709 and weighted average of 27.2%, a difference of 13.7%.
Single Mother Poverty Correlation Summary
| Measurement | Vietnamese | Immigrants from Romania |
| Minimum | 5.3% | 5.2% |
| Maximum | 100.0% | 100.0% |
| Range | 94.7% | 94.8% |
| Mean | 33.6% | 35.7% |
| Median | 29.4% | 27.8% |
| Interquartile 25% (IQ1) | 21.7% | 23.8% |
| Interquartile 75% (IQ3) | 41.0% | 43.1% |
| Interquartile Range (IQR) | 19.2% | 19.3% |
| Standard Deviation (Sample) | 19.1% | 24.1% |
| Standard Deviation (Population) | 19.0% | 23.8% |
Similar Demographics by Single Mother Poverty
Demographics Similar to Vietnamese by Single Mother Poverty
In terms of single mother poverty, the demographic groups most similar to Vietnamese are Tlingit-Haida (30.9%, a difference of 0.12%), Alaska Native (30.9%, a difference of 0.13%), Cape Verdean (30.8%, a difference of 0.15%), Celtic (30.9%, a difference of 0.16%), and French Canadian (30.8%, a difference of 0.22%).
| Demographics | Rating | Rank | Single Mother Poverty |
| Bermudans | 1.6 /100 | #243 | Tragic 30.6% |
| French | 1.3 /100 | #244 | Tragic 30.7% |
| Barbadians | 1.3 /100 | #245 | Tragic 30.7% |
| Ecuadorians | 0.9 /100 | #246 | Tragic 30.8% |
| West Indians | 0.9 /100 | #247 | Tragic 30.8% |
| French Canadians | 0.9 /100 | #248 | Tragic 30.8% |
| Cape Verdeans | 0.8 /100 | #249 | Tragic 30.8% |
| Vietnamese | 0.7 /100 | #250 | Tragic 30.9% |
| Tlingit-Haida | 0.6 /100 | #251 | Tragic 30.9% |
| Alaska Natives | 0.6 /100 | #252 | Tragic 30.9% |
| Celtics | 0.6 /100 | #253 | Tragic 30.9% |
| Senegalese | 0.5 /100 | #254 | Tragic 31.0% |
| Belizeans | 0.5 /100 | #255 | Tragic 31.0% |
| Immigrants | West Indies | 0.4 /100 | #256 | Tragic 31.1% |
| Immigrants | Bahamas | 0.4 /100 | #257 | Tragic 31.1% |
Demographics Similar to Immigrants from Romania by Single Mother Poverty
In terms of single mother poverty, the demographic groups most similar to Immigrants from Romania are Palestinian (27.2%, a difference of 0.030%), Immigrants from Egypt (27.1%, a difference of 0.050%), Immigrants from Bulgaria (27.1%, a difference of 0.080%), Immigrants from Jordan (27.1%, a difference of 0.11%), and Immigrants from South Eastern Asia (27.1%, a difference of 0.15%).
| Demographics | Rating | Rank | Single Mother Poverty |
| Cambodians | 99.8 /100 | #49 | Exceptional 27.0% |
| Laotians | 99.8 /100 | #50 | Exceptional 27.0% |
| Immigrants | Argentina | 99.7 /100 | #51 | Exceptional 27.1% |
| Immigrants | South Eastern Asia | 99.7 /100 | #52 | Exceptional 27.1% |
| Immigrants | Jordan | 99.7 /100 | #53 | Exceptional 27.1% |
| Immigrants | Bulgaria | 99.7 /100 | #54 | Exceptional 27.1% |
| Immigrants | Egypt | 99.7 /100 | #55 | Exceptional 27.1% |
| Immigrants | Romania | 99.7 /100 | #56 | Exceptional 27.2% |
| Palestinians | 99.7 /100 | #57 | Exceptional 27.2% |
| Argentineans | 99.6 /100 | #58 | Exceptional 27.2% |
| Paraguayans | 99.6 /100 | #59 | Exceptional 27.2% |
| Eastern Europeans | 99.6 /100 | #60 | Exceptional 27.2% |
| Immigrants | Eastern Europe | 99.6 /100 | #61 | Exceptional 27.2% |
| Immigrants | Malaysia | 99.5 /100 | #62 | Exceptional 27.3% |
| Immigrants | Northern Europe | 99.5 /100 | #63 | Exceptional 27.3% |