Vietnamese vs Zimbabwean Single Mother Poverty
COMPARE
Vietnamese
Zimbabwean
Single Mother Poverty
Single Mother Poverty Comparison
Vietnamese
Zimbabweans
30.9%
SINGLE MOTHER POVERTY
0.7/ 100
METRIC RATING
250th/ 347
METRIC RANK
27.9%
SINGLE MOTHER POVERTY
97.1/ 100
METRIC RATING
100th/ 347
METRIC RANK
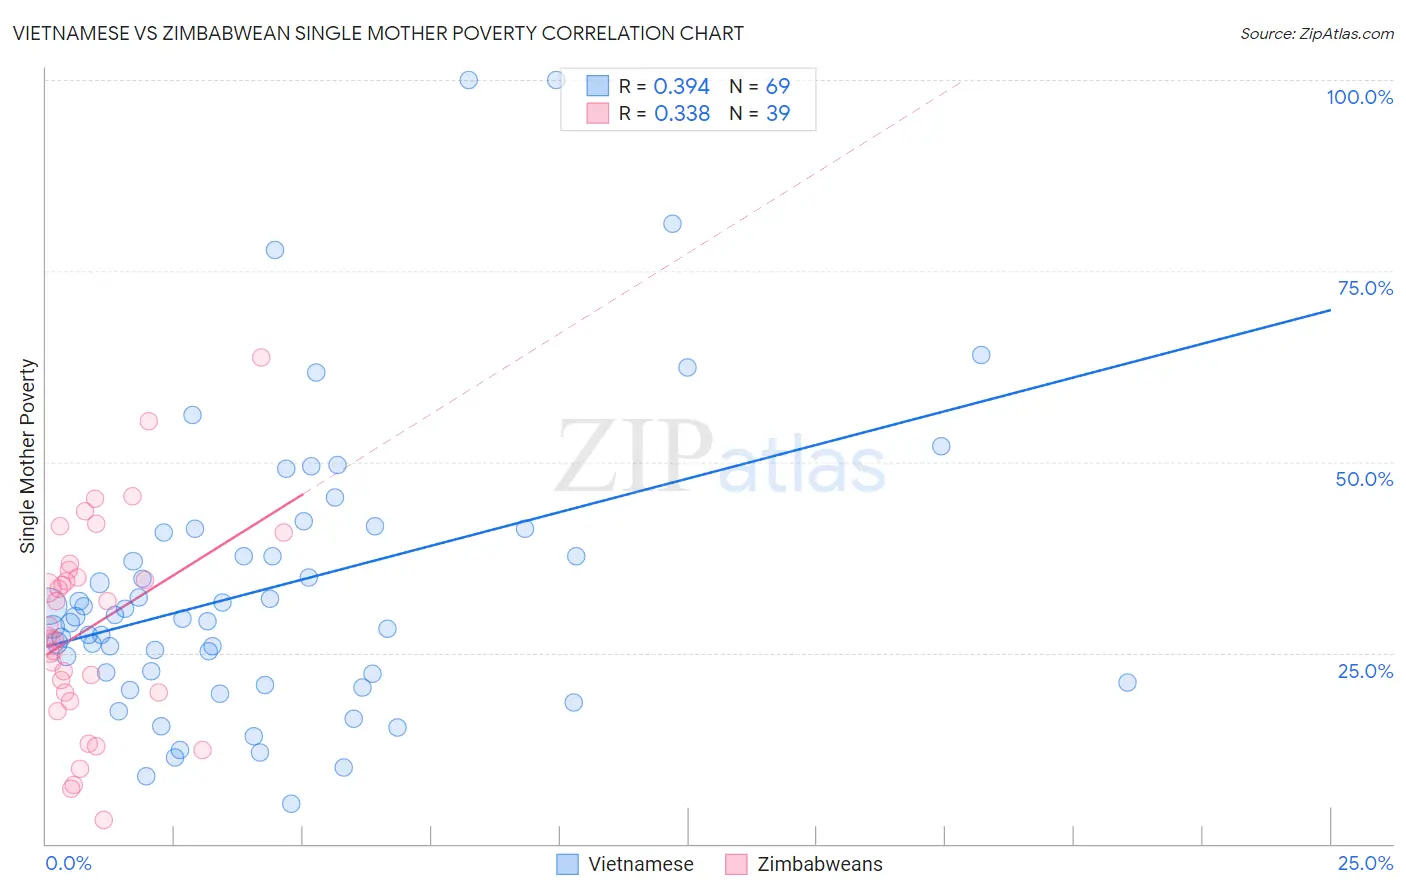
Vietnamese vs Zimbabwean Single Mother Poverty Correlation Chart
The statistical analysis conducted on geographies consisting of 168,932,056 people shows a mild positive correlation between the proportion of Vietnamese and poverty level among single mothers in the United States with a correlation coefficient (R) of 0.394 and weighted average of 30.9%. Similarly, the statistical analysis conducted on geographies consisting of 68,932,281 people shows a mild positive correlation between the proportion of Zimbabweans and poverty level among single mothers in the United States with a correlation coefficient (R) of 0.338 and weighted average of 27.9%, a difference of 10.5%.
Single Mother Poverty Correlation Summary
| Measurement | Vietnamese | Zimbabwean |
| Minimum | 5.3% | 3.1% |
| Maximum | 100.0% | 63.7% |
| Range | 94.7% | 60.6% |
| Mean | 33.6% | 28.4% |
| Median | 29.4% | 27.1% |
| Interquartile 25% (IQ1) | 21.7% | 19.7% |
| Interquartile 75% (IQ3) | 41.0% | 35.9% |
| Interquartile Range (IQR) | 19.2% | 16.1% |
| Standard Deviation (Sample) | 19.1% | 13.3% |
| Standard Deviation (Population) | 19.0% | 13.2% |
Similar Demographics by Single Mother Poverty
Demographics Similar to Vietnamese by Single Mother Poverty
In terms of single mother poverty, the demographic groups most similar to Vietnamese are Tlingit-Haida (30.9%, a difference of 0.12%), Alaska Native (30.9%, a difference of 0.13%), Cape Verdean (30.8%, a difference of 0.15%), Celtic (30.9%, a difference of 0.16%), and French Canadian (30.8%, a difference of 0.22%).
| Demographics | Rating | Rank | Single Mother Poverty |
| Bermudans | 1.6 /100 | #243 | Tragic 30.6% |
| French | 1.3 /100 | #244 | Tragic 30.7% |
| Barbadians | 1.3 /100 | #245 | Tragic 30.7% |
| Ecuadorians | 0.9 /100 | #246 | Tragic 30.8% |
| West Indians | 0.9 /100 | #247 | Tragic 30.8% |
| French Canadians | 0.9 /100 | #248 | Tragic 30.8% |
| Cape Verdeans | 0.8 /100 | #249 | Tragic 30.8% |
| Vietnamese | 0.7 /100 | #250 | Tragic 30.9% |
| Tlingit-Haida | 0.6 /100 | #251 | Tragic 30.9% |
| Alaska Natives | 0.6 /100 | #252 | Tragic 30.9% |
| Celtics | 0.6 /100 | #253 | Tragic 30.9% |
| Senegalese | 0.5 /100 | #254 | Tragic 31.0% |
| Belizeans | 0.5 /100 | #255 | Tragic 31.0% |
| Immigrants | West Indies | 0.4 /100 | #256 | Tragic 31.1% |
| Immigrants | Bahamas | 0.4 /100 | #257 | Tragic 31.1% |
Demographics Similar to Zimbabweans by Single Mother Poverty
In terms of single mother poverty, the demographic groups most similar to Zimbabweans are Immigrants from Netherlands (27.9%, a difference of 0.050%), Immigrants from Nepal (27.9%, a difference of 0.060%), Immigrants from Brazil (27.9%, a difference of 0.070%), Pakistani (28.0%, a difference of 0.070%), and Immigrants from Iraq (27.9%, a difference of 0.11%).
| Demographics | Rating | Rank | Single Mother Poverty |
| Romanians | 97.8 /100 | #93 | Exceptional 27.8% |
| Albanians | 97.6 /100 | #94 | Exceptional 27.9% |
| Chileans | 97.5 /100 | #95 | Exceptional 27.9% |
| Immigrants | Iraq | 97.3 /100 | #96 | Exceptional 27.9% |
| Immigrants | Brazil | 97.2 /100 | #97 | Exceptional 27.9% |
| Immigrants | Nepal | 97.2 /100 | #98 | Exceptional 27.9% |
| Immigrants | Netherlands | 97.2 /100 | #99 | Exceptional 27.9% |
| Zimbabweans | 97.1 /100 | #100 | Exceptional 27.9% |
| Pakistanis | 96.9 /100 | #101 | Exceptional 28.0% |
| Immigrants | Croatia | 96.7 /100 | #102 | Exceptional 28.0% |
| Immigrants | Northern Africa | 96.6 /100 | #103 | Exceptional 28.0% |
| Italians | 96.6 /100 | #104 | Exceptional 28.0% |
| Israelis | 96.5 /100 | #105 | Exceptional 28.0% |
| Ukrainians | 96.4 /100 | #106 | Exceptional 28.0% |
| Immigrants | Venezuela | 95.8 /100 | #107 | Exceptional 28.1% |