Vietnamese vs Immigrants from Indonesia Female Poverty
COMPARE
Vietnamese
Immigrants from Indonesia
Female Poverty
Female Poverty Comparison
Vietnamese
Immigrants from Indonesia
16.1%
FEMALE POVERTY
0.0/ 100
METRIC RATING
280th/ 347
METRIC RANK
12.5%
FEMALE POVERTY
95.4/ 100
METRIC RATING
94th/ 347
METRIC RANK
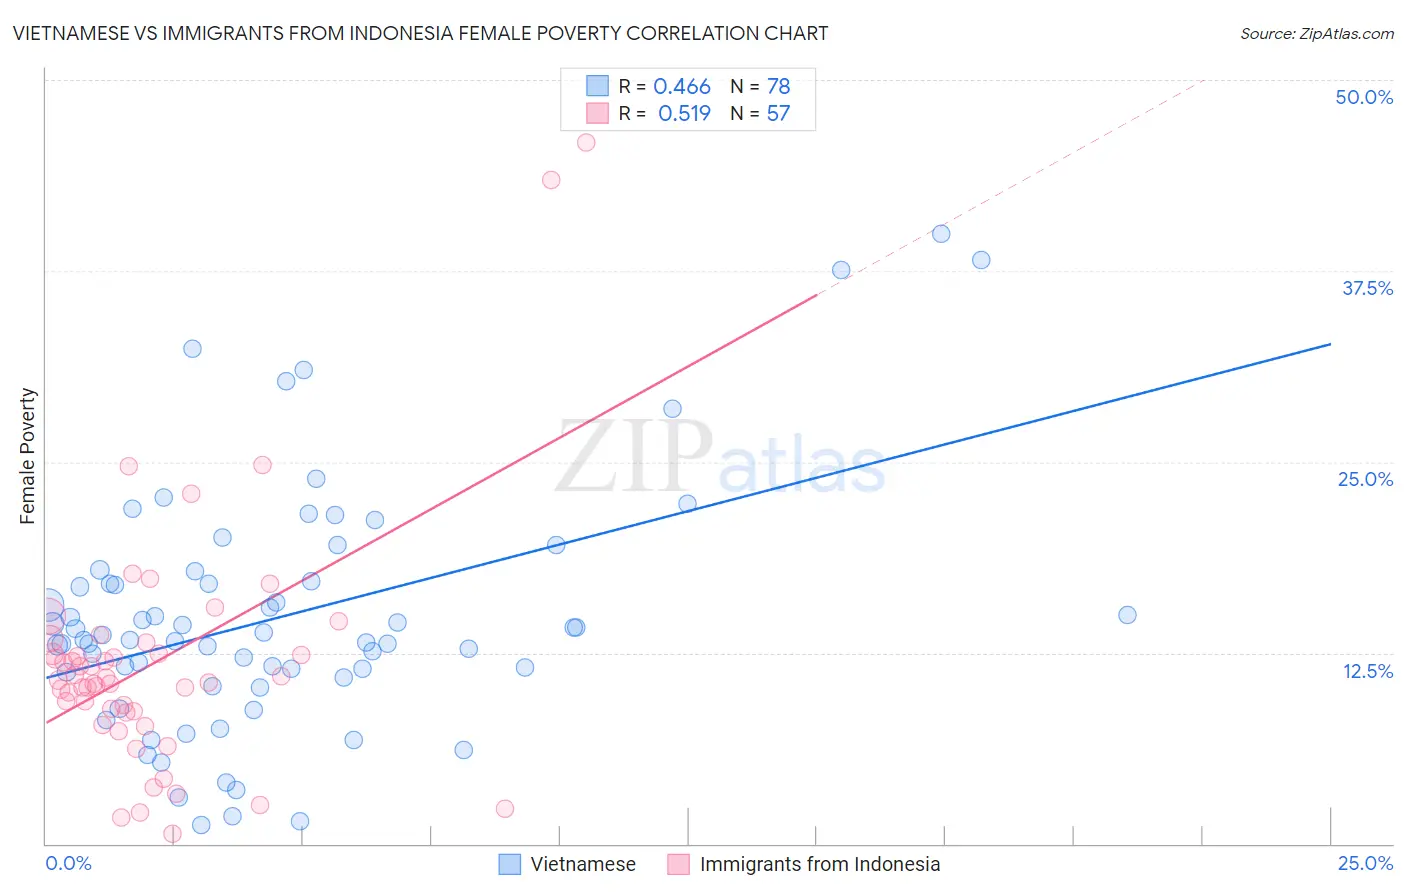
Vietnamese vs Immigrants from Indonesia Female Poverty Correlation Chart
The statistical analysis conducted on geographies consisting of 170,651,264 people shows a moderate positive correlation between the proportion of Vietnamese and poverty level among females in the United States with a correlation coefficient (R) of 0.466 and weighted average of 16.1%. Similarly, the statistical analysis conducted on geographies consisting of 215,706,539 people shows a substantial positive correlation between the proportion of Immigrants from Indonesia and poverty level among females in the United States with a correlation coefficient (R) of 0.519 and weighted average of 12.5%, a difference of 29.3%.
Female Poverty Correlation Summary
| Measurement | Vietnamese | Immigrants from Indonesia |
| Minimum | 1.2% | 0.67% |
| Maximum | 39.9% | 45.9% |
| Range | 38.7% | 45.2% |
| Mean | 14.9% | 11.9% |
| Median | 13.5% | 10.7% |
| Interquartile 25% (IQ1) | 11.2% | 8.6% |
| Interquartile 75% (IQ3) | 17.2% | 12.8% |
| Interquartile Range (IQR) | 6.0% | 4.2% |
| Standard Deviation (Sample) | 8.0% | 8.1% |
| Standard Deviation (Population) | 7.9% | 8.0% |
Similar Demographics by Female Poverty
Demographics Similar to Vietnamese by Female Poverty
In terms of female poverty, the demographic groups most similar to Vietnamese are West Indian (16.1%, a difference of 0.020%), Immigrants from Haiti (16.1%, a difference of 0.17%), Immigrants from Bahamas (16.1%, a difference of 0.24%), Immigrants from Cuba (16.1%, a difference of 0.26%), and Spanish American (16.2%, a difference of 0.31%).
| Demographics | Rating | Rank | Female Poverty |
| Haitians | 0.0 /100 | #273 | Tragic 15.9% |
| Barbadians | 0.0 /100 | #274 | Tragic 15.9% |
| Immigrants | Barbados | 0.0 /100 | #275 | Tragic 16.0% |
| Central Americans | 0.0 /100 | #276 | Tragic 16.0% |
| Bangladeshis | 0.0 /100 | #277 | Tragic 16.0% |
| Immigrants | West Indies | 0.0 /100 | #278 | Tragic 16.1% |
| Immigrants | Bahamas | 0.0 /100 | #279 | Tragic 16.1% |
| Vietnamese | 0.0 /100 | #280 | Tragic 16.1% |
| West Indians | 0.0 /100 | #281 | Tragic 16.1% |
| Immigrants | Haiti | 0.0 /100 | #282 | Tragic 16.1% |
| Immigrants | Cuba | 0.0 /100 | #283 | Tragic 16.1% |
| Spanish Americans | 0.0 /100 | #284 | Tragic 16.2% |
| Comanche | 0.0 /100 | #285 | Tragic 16.2% |
| Inupiat | 0.0 /100 | #286 | Tragic 16.2% |
| Immigrants | Belize | 0.0 /100 | #287 | Tragic 16.3% |
Demographics Similar to Immigrants from Indonesia by Female Poverty
In terms of female poverty, the demographic groups most similar to Immigrants from Indonesia are Immigrants from Egypt (12.5%, a difference of 0.030%), Immigrants from South Africa (12.5%, a difference of 0.040%), British (12.5%, a difference of 0.11%), Australian (12.5%, a difference of 0.14%), and Native Hawaiian (12.5%, a difference of 0.17%).
| Demographics | Rating | Rank | Female Poverty |
| Okinawans | 96.4 /100 | #87 | Exceptional 12.4% |
| Finns | 96.4 /100 | #88 | Exceptional 12.4% |
| English | 96.1 /100 | #89 | Exceptional 12.4% |
| Immigrants | Denmark | 95.8 /100 | #90 | Exceptional 12.4% |
| Belgians | 95.8 /100 | #91 | Exceptional 12.4% |
| Czechoslovakians | 95.7 /100 | #92 | Exceptional 12.4% |
| Immigrants | Egypt | 95.5 /100 | #93 | Exceptional 12.5% |
| Immigrants | Indonesia | 95.4 /100 | #94 | Exceptional 12.5% |
| Immigrants | South Africa | 95.4 /100 | #95 | Exceptional 12.5% |
| British | 95.2 /100 | #96 | Exceptional 12.5% |
| Australians | 95.2 /100 | #97 | Exceptional 12.5% |
| Native Hawaiians | 95.1 /100 | #98 | Exceptional 12.5% |
| Romanians | 95.1 /100 | #99 | Exceptional 12.5% |
| Immigrants | Latvia | 94.8 /100 | #100 | Exceptional 12.5% |
| Tlingit-Haida | 94.8 /100 | #101 | Exceptional 12.5% |