Vietnamese vs Immigrants from Central America Female Poverty
COMPARE
Vietnamese
Immigrants from Central America
Female Poverty
Female Poverty Comparison
Vietnamese
Immigrants from Central America
16.1%
FEMALE POVERTY
0.0/ 100
METRIC RATING
280th/ 347
METRIC RANK
16.8%
FEMALE POVERTY
0.0/ 100
METRIC RATING
304th/ 347
METRIC RANK
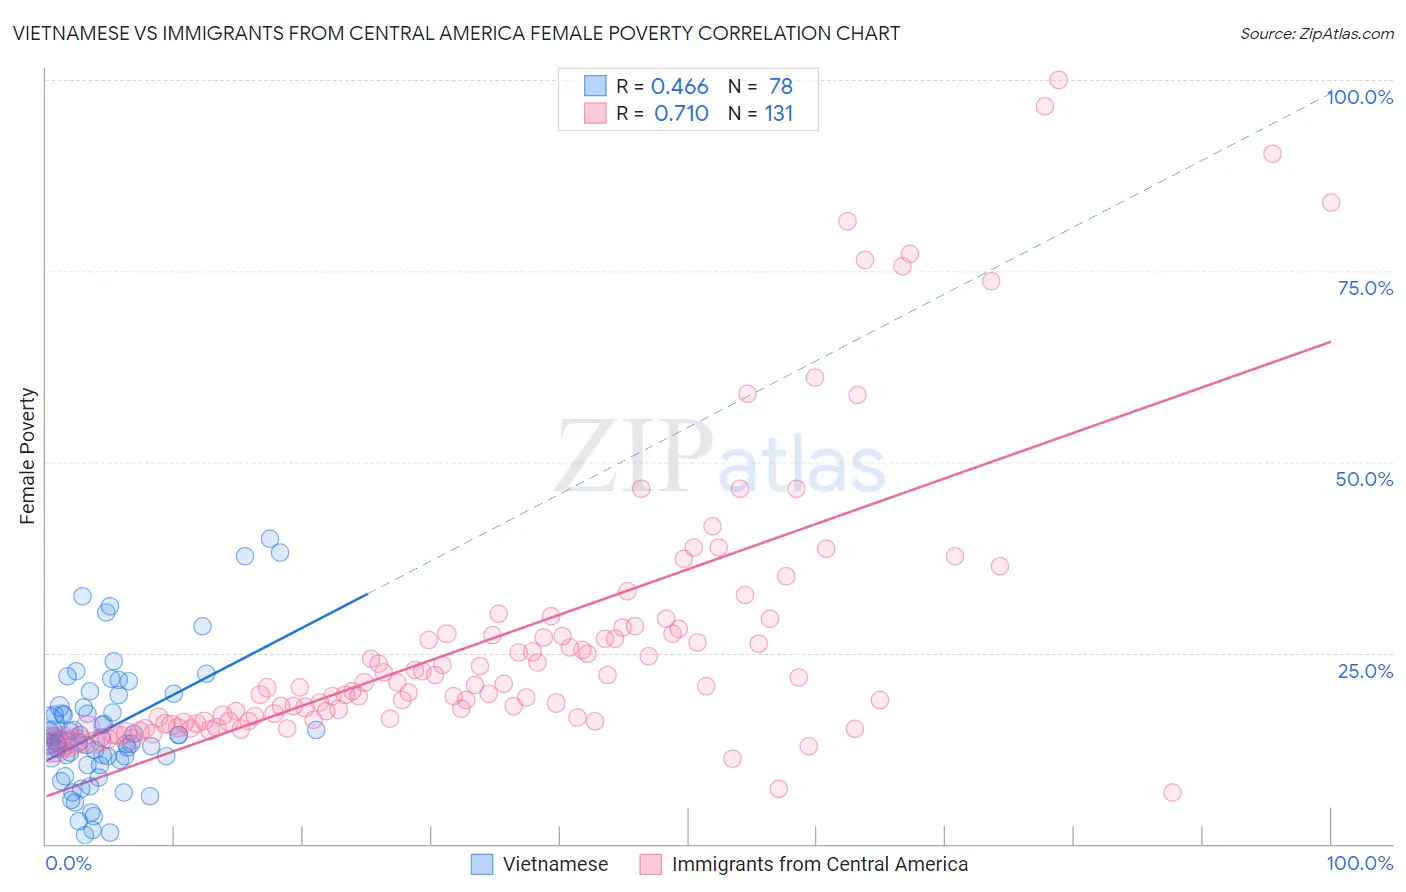
Vietnamese vs Immigrants from Central America Female Poverty Correlation Chart
The statistical analysis conducted on geographies consisting of 170,651,264 people shows a moderate positive correlation between the proportion of Vietnamese and poverty level among females in the United States with a correlation coefficient (R) of 0.466 and weighted average of 16.1%. Similarly, the statistical analysis conducted on geographies consisting of 535,791,715 people shows a strong positive correlation between the proportion of Immigrants from Central America and poverty level among females in the United States with a correlation coefficient (R) of 0.710 and weighted average of 16.8%, a difference of 4.4%.
Female Poverty Correlation Summary
| Measurement | Vietnamese | Immigrants from Central America |
| Minimum | 1.2% | 6.7% |
| Maximum | 39.9% | 100.0% |
| Range | 38.7% | 93.3% |
| Mean | 14.9% | 26.7% |
| Median | 13.5% | 20.4% |
| Interquartile 25% (IQ1) | 11.2% | 16.0% |
| Interquartile 75% (IQ3) | 17.2% | 27.6% |
| Interquartile Range (IQR) | 6.0% | 11.5% |
| Standard Deviation (Sample) | 8.0% | 18.5% |
| Standard Deviation (Population) | 7.9% | 18.4% |
Similar Demographics by Female Poverty
Demographics Similar to Vietnamese by Female Poverty
In terms of female poverty, the demographic groups most similar to Vietnamese are West Indian (16.1%, a difference of 0.020%), Immigrants from Haiti (16.1%, a difference of 0.17%), Immigrants from Bahamas (16.1%, a difference of 0.24%), Immigrants from Cuba (16.1%, a difference of 0.26%), and Spanish American (16.2%, a difference of 0.31%).
| Demographics | Rating | Rank | Female Poverty |
| Haitians | 0.0 /100 | #273 | Tragic 15.9% |
| Barbadians | 0.0 /100 | #274 | Tragic 15.9% |
| Immigrants | Barbados | 0.0 /100 | #275 | Tragic 16.0% |
| Central Americans | 0.0 /100 | #276 | Tragic 16.0% |
| Bangladeshis | 0.0 /100 | #277 | Tragic 16.0% |
| Immigrants | West Indies | 0.0 /100 | #278 | Tragic 16.1% |
| Immigrants | Bahamas | 0.0 /100 | #279 | Tragic 16.1% |
| Vietnamese | 0.0 /100 | #280 | Tragic 16.1% |
| West Indians | 0.0 /100 | #281 | Tragic 16.1% |
| Immigrants | Haiti | 0.0 /100 | #282 | Tragic 16.1% |
| Immigrants | Cuba | 0.0 /100 | #283 | Tragic 16.1% |
| Spanish Americans | 0.0 /100 | #284 | Tragic 16.2% |
| Comanche | 0.0 /100 | #285 | Tragic 16.2% |
| Inupiat | 0.0 /100 | #286 | Tragic 16.2% |
| Immigrants | Belize | 0.0 /100 | #287 | Tragic 16.3% |
Demographics Similar to Immigrants from Central America by Female Poverty
In terms of female poverty, the demographic groups most similar to Immigrants from Central America are Immigrants from Grenada (16.8%, a difference of 0.0%), Choctaw (16.8%, a difference of 0.060%), Immigrants from Caribbean (16.9%, a difference of 0.27%), Seminole (16.9%, a difference of 0.40%), and African (16.9%, a difference of 0.46%).
| Demographics | Rating | Rank | Female Poverty |
| Mexicans | 0.0 /100 | #297 | Tragic 16.5% |
| Somalis | 0.0 /100 | #298 | Tragic 16.6% |
| Hispanics or Latinos | 0.0 /100 | #299 | Tragic 16.6% |
| Bahamians | 0.0 /100 | #300 | Tragic 16.6% |
| Guatemalans | 0.0 /100 | #301 | Tragic 16.7% |
| Chippewa | 0.0 /100 | #302 | Tragic 16.7% |
| Choctaw | 0.0 /100 | #303 | Tragic 16.8% |
| Immigrants | Central America | 0.0 /100 | #304 | Tragic 16.8% |
| Immigrants | Grenada | 0.0 /100 | #305 | Tragic 16.8% |
| Immigrants | Caribbean | 0.0 /100 | #306 | Tragic 16.9% |
| Seminole | 0.0 /100 | #307 | Tragic 16.9% |
| Africans | 0.0 /100 | #308 | Tragic 16.9% |
| Immigrants | Mexico | 0.0 /100 | #309 | Tragic 17.0% |
| Creek | 0.0 /100 | #310 | Tragic 17.0% |
| Immigrants | Guatemala | 0.0 /100 | #311 | Tragic 17.0% |