Vietnamese vs Immigrants from Hungary Female Poverty
COMPARE
Vietnamese
Immigrants from Hungary
Female Poverty
Female Poverty Comparison
Vietnamese
Immigrants from Hungary
16.1%
FEMALE POVERTY
0.0/ 100
METRIC RATING
280th/ 347
METRIC RANK
12.7%
FEMALE POVERTY
90.3/ 100
METRIC RATING
121st/ 347
METRIC RANK
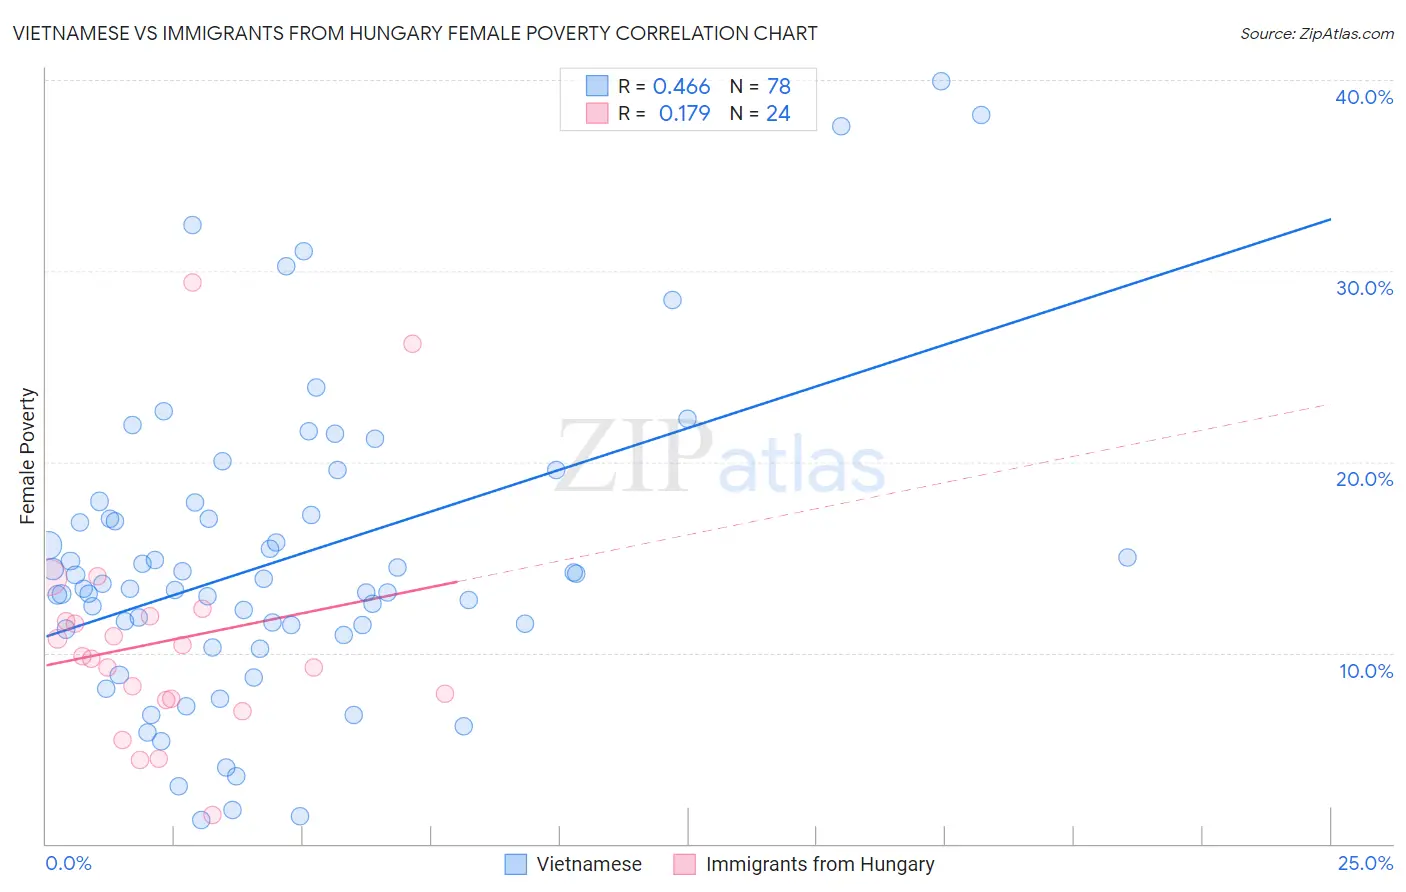
Vietnamese vs Immigrants from Hungary Female Poverty Correlation Chart
The statistical analysis conducted on geographies consisting of 170,651,264 people shows a moderate positive correlation between the proportion of Vietnamese and poverty level among females in the United States with a correlation coefficient (R) of 0.466 and weighted average of 16.1%. Similarly, the statistical analysis conducted on geographies consisting of 195,645,999 people shows a poor positive correlation between the proportion of Immigrants from Hungary and poverty level among females in the United States with a correlation coefficient (R) of 0.179 and weighted average of 12.7%, a difference of 26.6%.
Female Poverty Correlation Summary
| Measurement | Vietnamese | Immigrants from Hungary |
| Minimum | 1.2% | 1.5% |
| Maximum | 39.9% | 29.4% |
| Range | 38.7% | 27.9% |
| Mean | 14.9% | 10.6% |
| Median | 13.5% | 9.8% |
| Interquartile 25% (IQ1) | 11.2% | 7.6% |
| Interquartile 75% (IQ3) | 17.2% | 11.8% |
| Interquartile Range (IQR) | 6.0% | 4.2% |
| Standard Deviation (Sample) | 8.0% | 6.1% |
| Standard Deviation (Population) | 7.9% | 6.0% |
Similar Demographics by Female Poverty
Demographics Similar to Vietnamese by Female Poverty
In terms of female poverty, the demographic groups most similar to Vietnamese are West Indian (16.1%, a difference of 0.020%), Immigrants from Haiti (16.1%, a difference of 0.17%), Immigrants from Bahamas (16.1%, a difference of 0.24%), Immigrants from Cuba (16.1%, a difference of 0.26%), and Spanish American (16.2%, a difference of 0.31%).
| Demographics | Rating | Rank | Female Poverty |
| Haitians | 0.0 /100 | #273 | Tragic 15.9% |
| Barbadians | 0.0 /100 | #274 | Tragic 15.9% |
| Immigrants | Barbados | 0.0 /100 | #275 | Tragic 16.0% |
| Central Americans | 0.0 /100 | #276 | Tragic 16.0% |
| Bangladeshis | 0.0 /100 | #277 | Tragic 16.0% |
| Immigrants | West Indies | 0.0 /100 | #278 | Tragic 16.1% |
| Immigrants | Bahamas | 0.0 /100 | #279 | Tragic 16.1% |
| Vietnamese | 0.0 /100 | #280 | Tragic 16.1% |
| West Indians | 0.0 /100 | #281 | Tragic 16.1% |
| Immigrants | Haiti | 0.0 /100 | #282 | Tragic 16.1% |
| Immigrants | Cuba | 0.0 /100 | #283 | Tragic 16.1% |
| Spanish Americans | 0.0 /100 | #284 | Tragic 16.2% |
| Comanche | 0.0 /100 | #285 | Tragic 16.2% |
| Inupiat | 0.0 /100 | #286 | Tragic 16.2% |
| Immigrants | Belize | 0.0 /100 | #287 | Tragic 16.3% |
Demographics Similar to Immigrants from Hungary by Female Poverty
In terms of female poverty, the demographic groups most similar to Immigrants from Hungary are French Canadian (12.7%, a difference of 0.040%), New Zealander (12.7%, a difference of 0.10%), Immigrants from South Eastern Asia (12.7%, a difference of 0.10%), Albanian (12.7%, a difference of 0.16%), and Sri Lankan (12.7%, a difference of 0.17%).
| Demographics | Rating | Rank | Female Poverty |
| Welsh | 91.6 /100 | #114 | Exceptional 12.7% |
| Puget Sound Salish | 91.5 /100 | #115 | Exceptional 12.7% |
| Immigrants | Russia | 91.2 /100 | #116 | Exceptional 12.7% |
| Immigrants | Southern Europe | 90.9 /100 | #117 | Exceptional 12.7% |
| Sri Lankans | 90.9 /100 | #118 | Exceptional 12.7% |
| Albanians | 90.8 /100 | #119 | Exceptional 12.7% |
| New Zealanders | 90.6 /100 | #120 | Exceptional 12.7% |
| Immigrants | Hungary | 90.3 /100 | #121 | Exceptional 12.7% |
| French Canadians | 90.2 /100 | #122 | Exceptional 12.7% |
| Immigrants | South Eastern Asia | 89.9 /100 | #123 | Excellent 12.7% |
| Immigrants | Norway | 89.3 /100 | #124 | Excellent 12.8% |
| Argentineans | 89.1 /100 | #125 | Excellent 12.8% |
| Immigrants | Ukraine | 88.8 /100 | #126 | Excellent 12.8% |
| South Africans | 88.4 /100 | #127 | Excellent 12.8% |
| Immigrants | Belarus | 88.2 /100 | #128 | Excellent 12.8% |