Vietnamese vs Immigrants from Ethiopia Male Poverty
COMPARE
Vietnamese
Immigrants from Ethiopia
Male Poverty
Male Poverty Comparison
Vietnamese
Immigrants from Ethiopia
13.8%
MALE POVERTY
0.0/ 100
METRIC RATING
291st/ 347
METRIC RANK
11.2%
MALE POVERTY
50.7/ 100
METRIC RATING
172nd/ 347
METRIC RANK
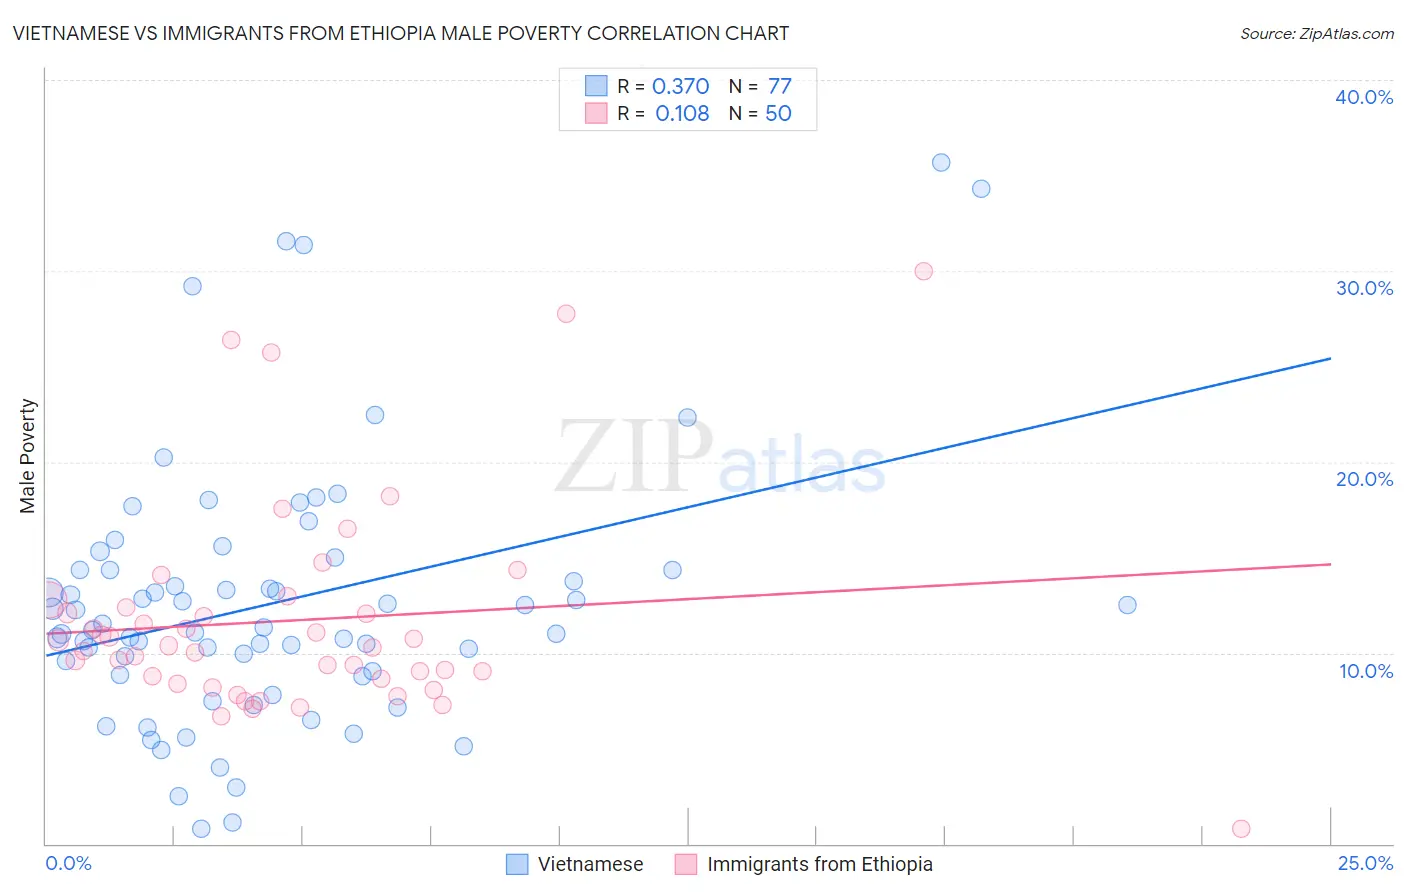
Vietnamese vs Immigrants from Ethiopia Male Poverty Correlation Chart
The statistical analysis conducted on geographies consisting of 170,649,781 people shows a mild positive correlation between the proportion of Vietnamese and poverty level among males in the United States with a correlation coefficient (R) of 0.370 and weighted average of 13.8%. Similarly, the statistical analysis conducted on geographies consisting of 211,452,093 people shows a poor positive correlation between the proportion of Immigrants from Ethiopia and poverty level among males in the United States with a correlation coefficient (R) of 0.108 and weighted average of 11.2%, a difference of 23.6%.
Male Poverty Correlation Summary
| Measurement | Vietnamese | Immigrants from Ethiopia |
| Minimum | 0.78% | 0.81% |
| Maximum | 35.7% | 30.0% |
| Range | 34.9% | 29.2% |
| Mean | 12.6% | 11.7% |
| Median | 11.4% | 10.3% |
| Interquartile 25% (IQ1) | 8.9% | 8.7% |
| Interquartile 75% (IQ3) | 14.3% | 12.4% |
| Interquartile Range (IQR) | 5.4% | 3.7% |
| Standard Deviation (Sample) | 6.9% | 5.6% |
| Standard Deviation (Population) | 6.8% | 5.5% |
Similar Demographics by Male Poverty
Demographics Similar to Vietnamese by Male Poverty
In terms of male poverty, the demographic groups most similar to Vietnamese are Immigrants from Zaire (13.8%, a difference of 0.090%), Guatemalan (13.8%, a difference of 0.10%), Indonesian (13.8%, a difference of 0.17%), Immigrants from Belize (13.8%, a difference of 0.18%), and Hispanic or Latino (13.9%, a difference of 0.24%).
| Demographics | Rating | Rank | Male Poverty |
| Immigrants | Haiti | 0.0 /100 | #284 | Tragic 13.8% |
| West Indians | 0.0 /100 | #285 | Tragic 13.8% |
| Shoshone | 0.0 /100 | #286 | Tragic 13.8% |
| Immigrants | Barbados | 0.0 /100 | #287 | Tragic 13.8% |
| Immigrants | St. Vincent and the Grenadines | 0.0 /100 | #288 | Tragic 13.8% |
| Guatemalans | 0.0 /100 | #289 | Tragic 13.8% |
| Immigrants | Zaire | 0.0 /100 | #290 | Tragic 13.8% |
| Vietnamese | 0.0 /100 | #291 | Tragic 13.8% |
| Indonesians | 0.0 /100 | #292 | Tragic 13.8% |
| Immigrants | Belize | 0.0 /100 | #293 | Tragic 13.8% |
| Hispanics or Latinos | 0.0 /100 | #294 | Tragic 13.9% |
| Immigrants | Central America | 0.0 /100 | #295 | Tragic 13.9% |
| Cajuns | 0.0 /100 | #296 | Tragic 13.9% |
| Inupiat | 0.0 /100 | #297 | Tragic 14.0% |
| Blackfeet | 0.0 /100 | #298 | Tragic 14.0% |
Demographics Similar to Immigrants from Ethiopia by Male Poverty
In terms of male poverty, the demographic groups most similar to Immigrants from Ethiopia are Pennsylvania German (11.2%, a difference of 0.020%), Uruguayan (11.2%, a difference of 0.040%), Immigrants from Oceania (11.2%, a difference of 0.070%), South American (11.1%, a difference of 0.30%), and Celtic (11.2%, a difference of 0.32%).
| Demographics | Rating | Rank | Male Poverty |
| Immigrants | Spain | 55.5 /100 | #165 | Average 11.1% |
| Immigrants | Albania | 55.3 /100 | #166 | Average 11.1% |
| Hungarians | 55.1 /100 | #167 | Average 11.1% |
| Immigrants | Portugal | 54.9 /100 | #168 | Average 11.1% |
| Immigrants | Colombia | 54.2 /100 | #169 | Average 11.1% |
| South Americans | 53.8 /100 | #170 | Average 11.1% |
| Uruguayans | 51.0 /100 | #171 | Average 11.2% |
| Immigrants | Ethiopia | 50.7 /100 | #172 | Average 11.2% |
| Pennsylvania Germans | 50.5 /100 | #173 | Average 11.2% |
| Immigrants | Oceania | 50.0 /100 | #174 | Average 11.2% |
| Celtics | 47.5 /100 | #175 | Average 11.2% |
| Immigrants | Fiji | 46.0 /100 | #176 | Average 11.2% |
| Lebanese | 45.6 /100 | #177 | Average 11.2% |
| Immigrants | Cameroon | 44.5 /100 | #178 | Average 11.2% |
| Immigrants | Syria | 40.3 /100 | #179 | Average 11.3% |