Vietnamese vs Colville Male Poverty
COMPARE
Vietnamese
Colville
Male Poverty
Male Poverty Comparison
Vietnamese
Colville
13.8%
MALE POVERTY
0.0/ 100
METRIC RATING
291st/ 347
METRIC RANK
15.2%
MALE POVERTY
0.0/ 100
METRIC RATING
323rd/ 347
METRIC RANK
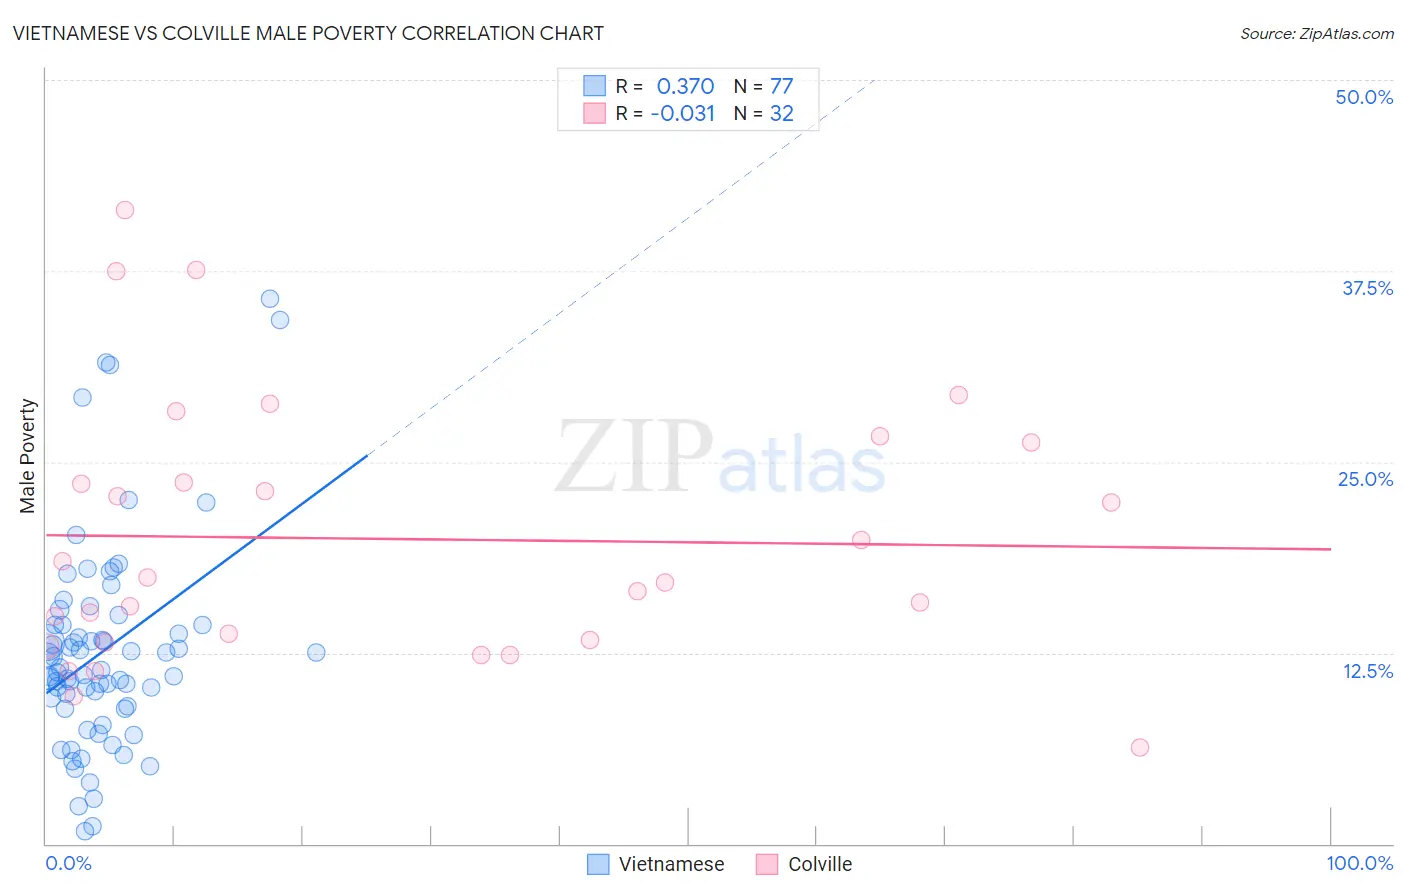
Vietnamese vs Colville Male Poverty Correlation Chart
The statistical analysis conducted on geographies consisting of 170,649,781 people shows a mild positive correlation between the proportion of Vietnamese and poverty level among males in the United States with a correlation coefficient (R) of 0.370 and weighted average of 13.8%. Similarly, the statistical analysis conducted on geographies consisting of 34,680,986 people shows no correlation between the proportion of Colville and poverty level among males in the United States with a correlation coefficient (R) of -0.031 and weighted average of 15.2%, a difference of 10.3%.
Male Poverty Correlation Summary
| Measurement | Vietnamese | Colville |
| Minimum | 0.78% | 6.3% |
| Maximum | 35.7% | 41.5% |
| Range | 34.9% | 35.2% |
| Mean | 12.6% | 20.0% |
| Median | 11.4% | 17.3% |
| Interquartile 25% (IQ1) | 8.9% | 13.3% |
| Interquartile 75% (IQ3) | 14.3% | 24.9% |
| Interquartile Range (IQR) | 5.4% | 11.7% |
| Standard Deviation (Sample) | 6.9% | 8.6% |
| Standard Deviation (Population) | 6.8% | 8.5% |
Similar Demographics by Male Poverty
Demographics Similar to Vietnamese by Male Poverty
In terms of male poverty, the demographic groups most similar to Vietnamese are Immigrants from Zaire (13.8%, a difference of 0.090%), Guatemalan (13.8%, a difference of 0.10%), Indonesian (13.8%, a difference of 0.17%), Immigrants from Belize (13.8%, a difference of 0.18%), and Hispanic or Latino (13.9%, a difference of 0.24%).
| Demographics | Rating | Rank | Male Poverty |
| Immigrants | Haiti | 0.0 /100 | #284 | Tragic 13.8% |
| West Indians | 0.0 /100 | #285 | Tragic 13.8% |
| Shoshone | 0.0 /100 | #286 | Tragic 13.8% |
| Immigrants | Barbados | 0.0 /100 | #287 | Tragic 13.8% |
| Immigrants | St. Vincent and the Grenadines | 0.0 /100 | #288 | Tragic 13.8% |
| Guatemalans | 0.0 /100 | #289 | Tragic 13.8% |
| Immigrants | Zaire | 0.0 /100 | #290 | Tragic 13.8% |
| Vietnamese | 0.0 /100 | #291 | Tragic 13.8% |
| Indonesians | 0.0 /100 | #292 | Tragic 13.8% |
| Immigrants | Belize | 0.0 /100 | #293 | Tragic 13.8% |
| Hispanics or Latinos | 0.0 /100 | #294 | Tragic 13.9% |
| Immigrants | Central America | 0.0 /100 | #295 | Tragic 13.9% |
| Cajuns | 0.0 /100 | #296 | Tragic 13.9% |
| Inupiat | 0.0 /100 | #297 | Tragic 14.0% |
| Blackfeet | 0.0 /100 | #298 | Tragic 14.0% |
Demographics Similar to Colville by Male Poverty
In terms of male poverty, the demographic groups most similar to Colville are Menominee (15.3%, a difference of 0.19%), Yakama (15.3%, a difference of 0.37%), Kiowa (15.2%, a difference of 0.39%), Central American Indian (15.3%, a difference of 0.48%), and Arapaho (15.1%, a difference of 1.1%).
| Demographics | Rating | Rank | Male Poverty |
| British West Indians | 0.0 /100 | #316 | Tragic 14.6% |
| Immigrants | Dominica | 0.0 /100 | #317 | Tragic 14.7% |
| Immigrants | Grenada | 0.0 /100 | #318 | Tragic 14.7% |
| U.S. Virgin Islanders | 0.0 /100 | #319 | Tragic 14.7% |
| Immigrants | Congo | 0.0 /100 | #320 | Tragic 14.7% |
| Arapaho | 0.0 /100 | #321 | Tragic 15.1% |
| Kiowa | 0.0 /100 | #322 | Tragic 15.2% |
| Colville | 0.0 /100 | #323 | Tragic 15.2% |
| Menominee | 0.0 /100 | #324 | Tragic 15.3% |
| Yakama | 0.0 /100 | #325 | Tragic 15.3% |
| Central American Indians | 0.0 /100 | #326 | Tragic 15.3% |
| Paiute | 0.0 /100 | #327 | Tragic 15.8% |
| Blacks/African Americans | 0.0 /100 | #328 | Tragic 15.8% |
| Dominicans | 0.0 /100 | #329 | Tragic 16.1% |
| Immigrants | Dominican Republic | 0.0 /100 | #330 | Tragic 16.2% |