Vietnamese vs Immigrants from Denmark Male Poverty
COMPARE
Vietnamese
Immigrants from Denmark
Male Poverty
Male Poverty Comparison
Vietnamese
Immigrants from Denmark
13.8%
MALE POVERTY
0.0/ 100
METRIC RATING
291st/ 347
METRIC RANK
10.4%
MALE POVERTY
95.0/ 100
METRIC RATING
89th/ 347
METRIC RANK
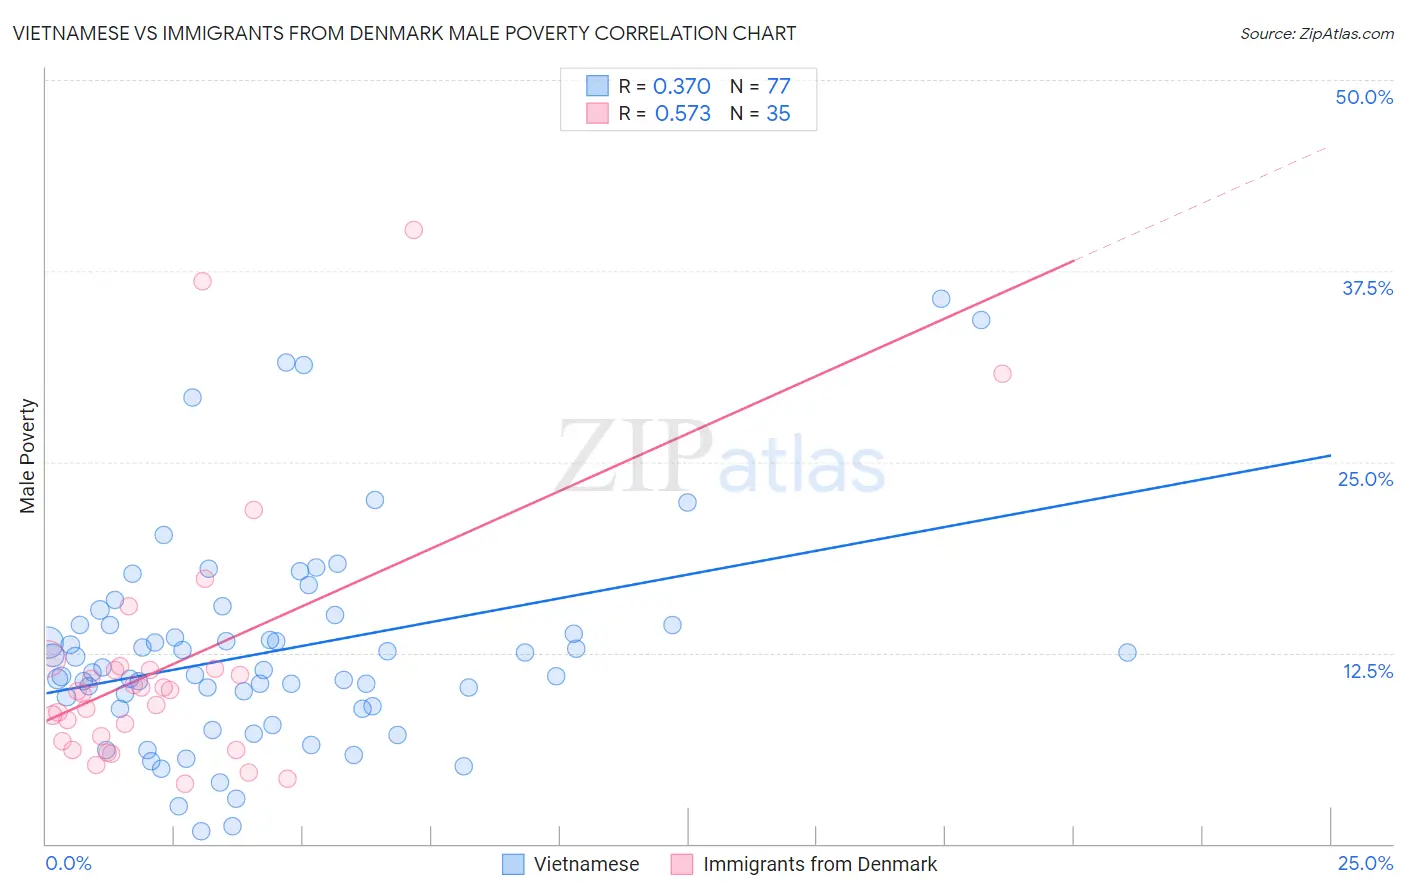
Vietnamese vs Immigrants from Denmark Male Poverty Correlation Chart
The statistical analysis conducted on geographies consisting of 170,649,781 people shows a mild positive correlation between the proportion of Vietnamese and poverty level among males in the United States with a correlation coefficient (R) of 0.370 and weighted average of 13.8%. Similarly, the statistical analysis conducted on geographies consisting of 136,389,161 people shows a substantial positive correlation between the proportion of Immigrants from Denmark and poverty level among males in the United States with a correlation coefficient (R) of 0.573 and weighted average of 10.4%, a difference of 33.1%.
Male Poverty Correlation Summary
| Measurement | Vietnamese | Immigrants from Denmark |
| Minimum | 0.78% | 4.0% |
| Maximum | 35.7% | 40.2% |
| Range | 34.9% | 36.2% |
| Mean | 12.6% | 11.7% |
| Median | 11.4% | 10.0% |
| Interquartile 25% (IQ1) | 8.9% | 6.7% |
| Interquartile 75% (IQ3) | 14.3% | 11.5% |
| Interquartile Range (IQR) | 5.4% | 4.8% |
| Standard Deviation (Sample) | 6.9% | 8.4% |
| Standard Deviation (Population) | 6.8% | 8.3% |
Similar Demographics by Male Poverty
Demographics Similar to Vietnamese by Male Poverty
In terms of male poverty, the demographic groups most similar to Vietnamese are Immigrants from Zaire (13.8%, a difference of 0.090%), Guatemalan (13.8%, a difference of 0.10%), Indonesian (13.8%, a difference of 0.17%), Immigrants from Belize (13.8%, a difference of 0.18%), and Hispanic or Latino (13.9%, a difference of 0.24%).
| Demographics | Rating | Rank | Male Poverty |
| Immigrants | Haiti | 0.0 /100 | #284 | Tragic 13.8% |
| West Indians | 0.0 /100 | #285 | Tragic 13.8% |
| Shoshone | 0.0 /100 | #286 | Tragic 13.8% |
| Immigrants | Barbados | 0.0 /100 | #287 | Tragic 13.8% |
| Immigrants | St. Vincent and the Grenadines | 0.0 /100 | #288 | Tragic 13.8% |
| Guatemalans | 0.0 /100 | #289 | Tragic 13.8% |
| Immigrants | Zaire | 0.0 /100 | #290 | Tragic 13.8% |
| Vietnamese | 0.0 /100 | #291 | Tragic 13.8% |
| Indonesians | 0.0 /100 | #292 | Tragic 13.8% |
| Immigrants | Belize | 0.0 /100 | #293 | Tragic 13.8% |
| Hispanics or Latinos | 0.0 /100 | #294 | Tragic 13.9% |
| Immigrants | Central America | 0.0 /100 | #295 | Tragic 13.9% |
| Cajuns | 0.0 /100 | #296 | Tragic 13.9% |
| Inupiat | 0.0 /100 | #297 | Tragic 14.0% |
| Blackfeet | 0.0 /100 | #298 | Tragic 14.0% |
Demographics Similar to Immigrants from Denmark by Male Poverty
In terms of male poverty, the demographic groups most similar to Immigrants from Denmark are Cambodian (10.4%, a difference of 0.0%), Indian (Asian) (10.4%, a difference of 0.020%), British (10.4%, a difference of 0.090%), Northern European (10.4%, a difference of 0.14%), and Immigrants from Eastern Asia (10.4%, a difference of 0.18%).
| Demographics | Rating | Rank | Male Poverty |
| Egyptians | 95.9 /100 | #82 | Exceptional 10.3% |
| Immigrants | Sweden | 95.7 /100 | #83 | Exceptional 10.3% |
| Czechoslovakians | 95.6 /100 | #84 | Exceptional 10.3% |
| Immigrants | England | 95.5 /100 | #85 | Exceptional 10.4% |
| Immigrants | Eastern Asia | 95.3 /100 | #86 | Exceptional 10.4% |
| Northern Europeans | 95.2 /100 | #87 | Exceptional 10.4% |
| Cambodians | 95.0 /100 | #88 | Exceptional 10.4% |
| Immigrants | Denmark | 95.0 /100 | #89 | Exceptional 10.4% |
| Indians (Asian) | 94.9 /100 | #90 | Exceptional 10.4% |
| British | 94.8 /100 | #91 | Exceptional 10.4% |
| Jordanians | 94.4 /100 | #92 | Exceptional 10.4% |
| Australians | 94.4 /100 | #93 | Exceptional 10.4% |
| Immigrants | South Africa | 94.1 /100 | #94 | Exceptional 10.4% |
| Scottish | 94.0 /100 | #95 | Exceptional 10.4% |
| Immigrants | Egypt | 93.7 /100 | #96 | Exceptional 10.4% |