Venezuelan vs Immigrants from Laos Associate's Degree
COMPARE
Venezuelan
Immigrants from Laos
Associate's Degree
Associate's Degree Comparison
Venezuelans
Immigrants from Laos
49.4%
ASSOCIATE'S DEGREE
97.0/ 100
METRIC RATING
104th/ 347
METRIC RANK
40.7%
ASSOCIATE'S DEGREE
0.1/ 100
METRIC RATING
271st/ 347
METRIC RANK
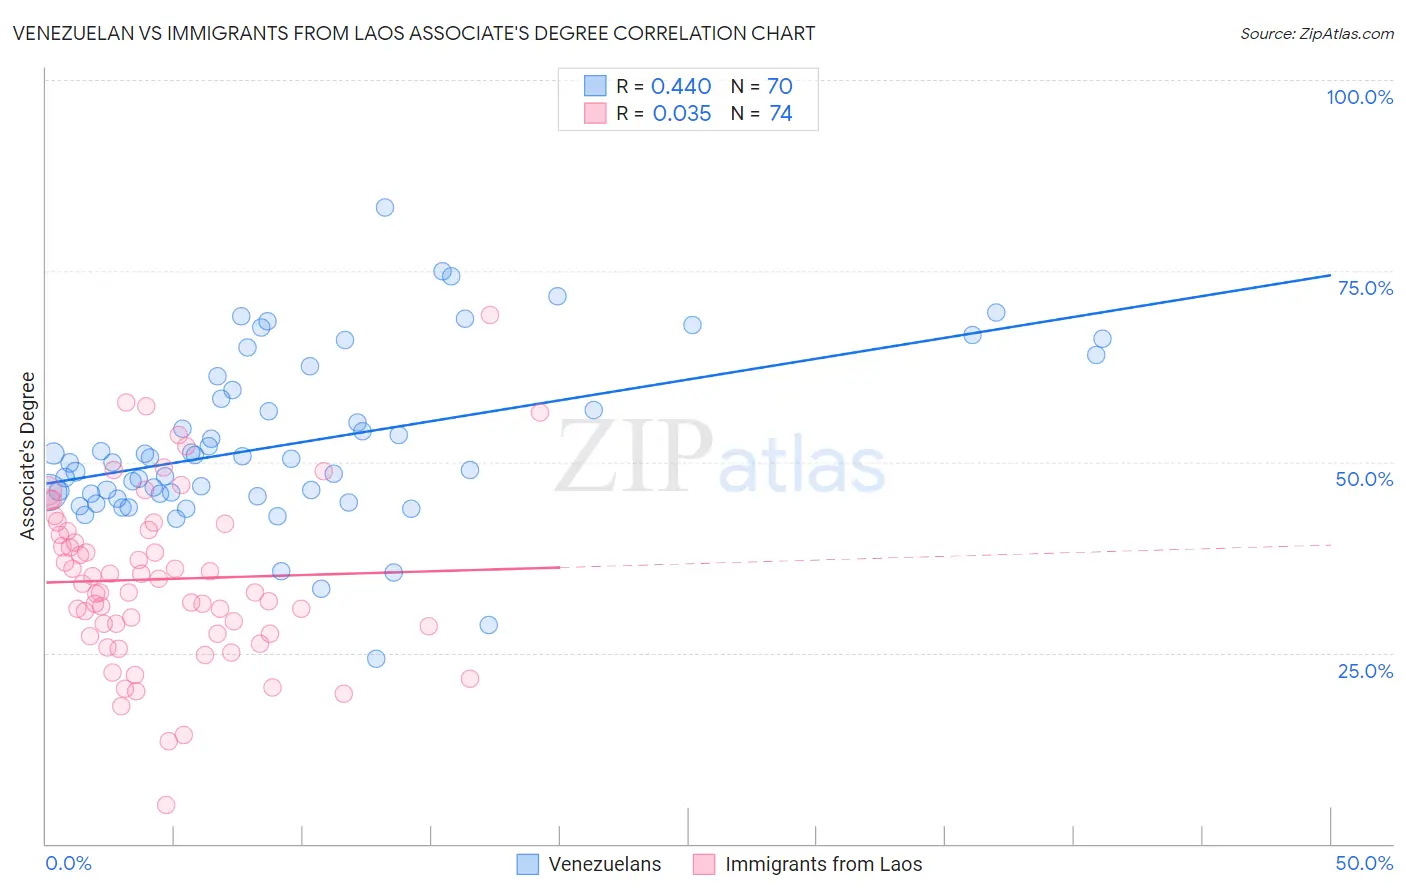
Venezuelan vs Immigrants from Laos Associate's Degree Correlation Chart
The statistical analysis conducted on geographies consisting of 306,307,372 people shows a moderate positive correlation between the proportion of Venezuelans and percentage of population with at least associate's degree education in the United States with a correlation coefficient (R) of 0.440 and weighted average of 49.4%. Similarly, the statistical analysis conducted on geographies consisting of 201,474,630 people shows no correlation between the proportion of Immigrants from Laos and percentage of population with at least associate's degree education in the United States with a correlation coefficient (R) of 0.035 and weighted average of 40.7%, a difference of 21.4%.
Associate's Degree Correlation Summary
| Measurement | Venezuelan | Immigrants from Laos |
| Minimum | 24.3% | 5.0% |
| Maximum | 83.4% | 69.3% |
| Range | 59.1% | 64.3% |
| Mean | 52.4% | 34.7% |
| Median | 50.1% | 33.4% |
| Interquartile 25% (IQ1) | 45.8% | 27.5% |
| Interquartile 75% (IQ3) | 59.4% | 41.0% |
| Interquartile Range (IQR) | 13.7% | 13.5% |
| Standard Deviation (Sample) | 11.2% | 11.3% |
| Standard Deviation (Population) | 11.1% | 11.2% |
Similar Demographics by Associate's Degree
Demographics Similar to Venezuelans by Associate's Degree
In terms of associate's degree, the demographic groups most similar to Venezuelans are Ukrainian (49.4%, a difference of 0.060%), Croatian (49.3%, a difference of 0.15%), Immigrants from Italy (49.3%, a difference of 0.15%), Chilean (49.4%, a difference of 0.17%), and Syrian (49.3%, a difference of 0.18%).
| Demographics | Rating | Rank | Associate's Degree |
| Immigrants | Ukraine | 98.0 /100 | #97 | Exceptional 49.7% |
| Immigrants | Northern Africa | 97.9 /100 | #98 | Exceptional 49.7% |
| Macedonians | 97.8 /100 | #99 | Exceptional 49.6% |
| Immigrants | Nepal | 97.5 /100 | #100 | Exceptional 49.5% |
| Northern Europeans | 97.3 /100 | #101 | Exceptional 49.5% |
| Chileans | 97.3 /100 | #102 | Exceptional 49.4% |
| Ukrainians | 97.1 /100 | #103 | Exceptional 49.4% |
| Venezuelans | 97.0 /100 | #104 | Exceptional 49.4% |
| Croatians | 96.8 /100 | #105 | Exceptional 49.3% |
| Immigrants | Italy | 96.7 /100 | #106 | Exceptional 49.3% |
| Syrians | 96.7 /100 | #107 | Exceptional 49.3% |
| Jordanians | 96.6 /100 | #108 | Exceptional 49.2% |
| Immigrants | Morocco | 96.3 /100 | #109 | Exceptional 49.2% |
| Austrians | 95.8 /100 | #110 | Exceptional 49.1% |
| Immigrants | Venezuela | 95.8 /100 | #111 | Exceptional 49.1% |
Demographics Similar to Immigrants from Laos by Associate's Degree
In terms of associate's degree, the demographic groups most similar to Immigrants from Laos are Belizean (40.6%, a difference of 0.070%), Chippewa (40.7%, a difference of 0.18%), American (40.8%, a difference of 0.23%), Puget Sound Salish (40.5%, a difference of 0.36%), and Central American Indian (40.8%, a difference of 0.41%).
| Demographics | Rating | Rank | Associate's Degree |
| Osage | 0.3 /100 | #264 | Tragic 41.5% |
| Africans | 0.2 /100 | #265 | Tragic 41.1% |
| Samoans | 0.2 /100 | #266 | Tragic 41.1% |
| Hawaiians | 0.2 /100 | #267 | Tragic 40.9% |
| Central American Indians | 0.2 /100 | #268 | Tragic 40.8% |
| Americans | 0.2 /100 | #269 | Tragic 40.8% |
| Chippewa | 0.2 /100 | #270 | Tragic 40.7% |
| Immigrants | Laos | 0.1 /100 | #271 | Tragic 40.7% |
| Belizeans | 0.1 /100 | #272 | Tragic 40.6% |
| Puget Sound Salish | 0.1 /100 | #273 | Tragic 40.5% |
| Immigrants | Dominica | 0.1 /100 | #274 | Tragic 40.5% |
| Potawatomi | 0.1 /100 | #275 | Tragic 40.4% |
| Puerto Ricans | 0.1 /100 | #276 | Tragic 40.4% |
| Blackfeet | 0.1 /100 | #277 | Tragic 40.3% |
| Ottawa | 0.1 /100 | #278 | Tragic 40.3% |