Ute vs Immigrants from Nicaragua In Labor Force | Age 35-44
COMPARE
Ute
Immigrants from Nicaragua
In Labor Force | Age 35-44
In Labor Force | Age 35-44 Comparison
Ute
Immigrants from Nicaragua
79.4%
IN LABOR FORCE | AGE 35-44
0.0/ 100
METRIC RATING
332nd/ 347
METRIC RANK
84.1%
IN LABOR FORCE | AGE 35-44
9.4/ 100
METRIC RATING
218th/ 347
METRIC RANK
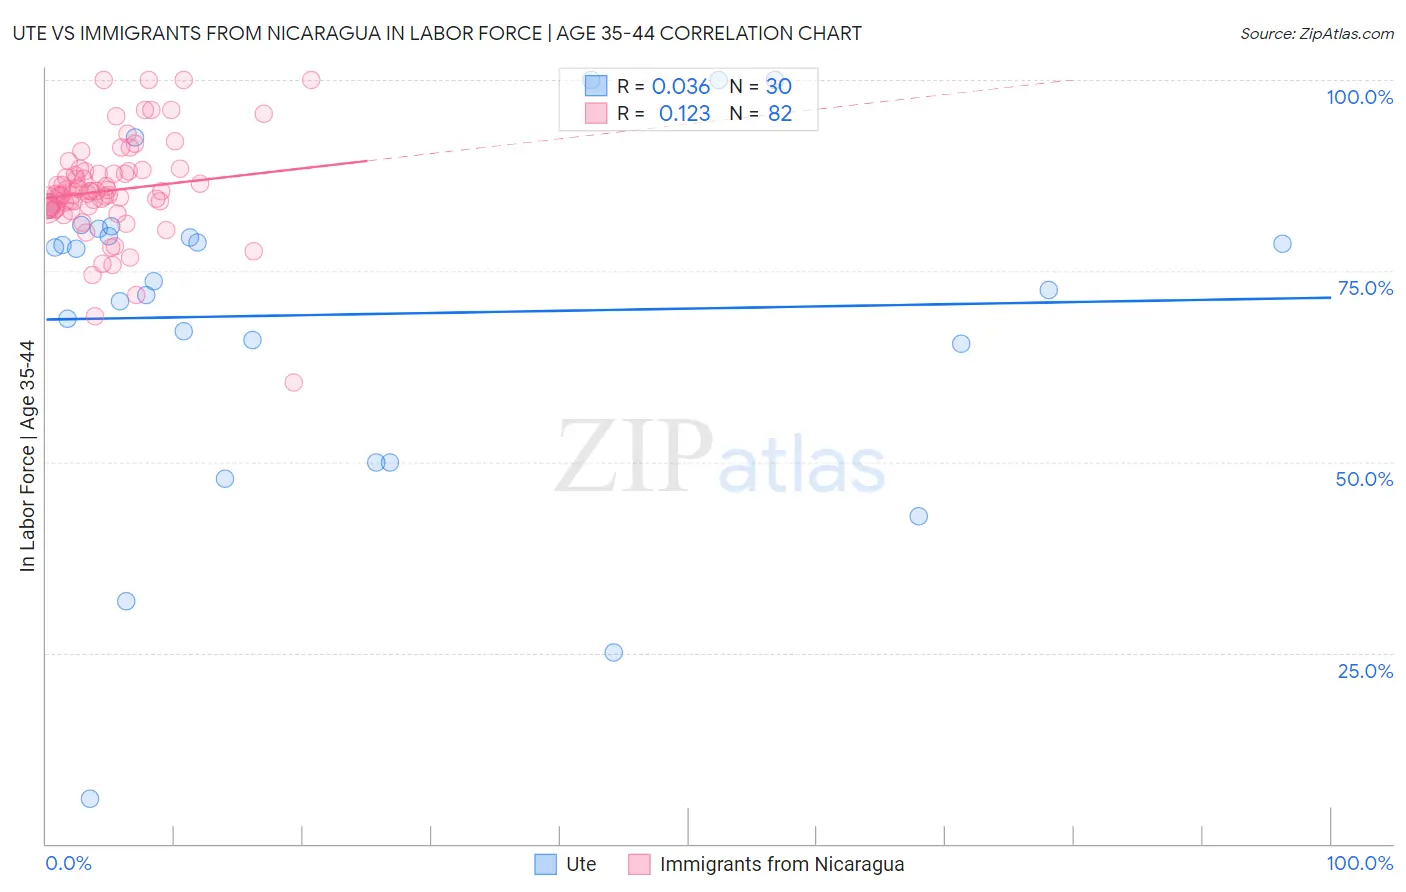
Ute vs Immigrants from Nicaragua In Labor Force | Age 35-44 Correlation Chart
The statistical analysis conducted on geographies consisting of 55,667,547 people shows no correlation between the proportion of Ute and labor force participation rate among population between the ages 35 and 44 in the United States with a correlation coefficient (R) of 0.036 and weighted average of 79.4%. Similarly, the statistical analysis conducted on geographies consisting of 236,329,760 people shows a poor positive correlation between the proportion of Immigrants from Nicaragua and labor force participation rate among population between the ages 35 and 44 in the United States with a correlation coefficient (R) of 0.123 and weighted average of 84.1%, a difference of 5.8%.
In Labor Force | Age 35-44 Correlation Summary
| Measurement | Ute | Immigrants from Nicaragua |
| Minimum | 5.9% | 60.4% |
| Maximum | 100.0% | 100.0% |
| Range | 94.1% | 39.6% |
| Mean | 69.3% | 85.5% |
| Median | 75.8% | 85.1% |
| Interquartile 25% (IQ1) | 65.5% | 83.4% |
| Interquartile 75% (IQ3) | 80.5% | 88.1% |
| Interquartile Range (IQR) | 15.0% | 4.7% |
| Standard Deviation (Sample) | 21.9% | 6.6% |
| Standard Deviation (Population) | 21.6% | 6.5% |
Similar Demographics by In Labor Force | Age 35-44
Demographics Similar to Ute by In Labor Force | Age 35-44
In terms of in labor force | age 35-44, the demographic groups most similar to Ute are Houma (79.5%, a difference of 0.060%), Cheyenne (79.5%, a difference of 0.080%), Menominee (79.7%, a difference of 0.28%), Kiowa (79.2%, a difference of 0.33%), and Yakama (79.0%, a difference of 0.62%).
| Demographics | Rating | Rank | In Labor Force | Age 35-44 |
| Dutch West Indians | 0.0 /100 | #325 | Tragic 80.4% |
| Seminole | 0.0 /100 | #326 | Tragic 80.4% |
| Sioux | 0.0 /100 | #327 | Tragic 80.2% |
| Creek | 0.0 /100 | #328 | Tragic 80.0% |
| Menominee | 0.0 /100 | #329 | Tragic 79.7% |
| Cheyenne | 0.0 /100 | #330 | Tragic 79.5% |
| Houma | 0.0 /100 | #331 | Tragic 79.5% |
| Ute | 0.0 /100 | #332 | Tragic 79.4% |
| Kiowa | 0.0 /100 | #333 | Tragic 79.2% |
| Yakama | 0.0 /100 | #334 | Tragic 79.0% |
| Natives/Alaskans | 0.0 /100 | #335 | Tragic 78.9% |
| Arapaho | 0.0 /100 | #336 | Tragic 78.1% |
| Apache | 0.0 /100 | #337 | Tragic 77.9% |
| Pueblo | 0.0 /100 | #338 | Tragic 77.4% |
| Yup'ik | 0.0 /100 | #339 | Tragic 77.3% |
Demographics Similar to Immigrants from Nicaragua by In Labor Force | Age 35-44
In terms of in labor force | age 35-44, the demographic groups most similar to Immigrants from Nicaragua are Subsaharan African (84.1%, a difference of 0.0%), Immigrants from Norway (84.1%, a difference of 0.040%), French (84.0%, a difference of 0.040%), European (84.1%, a difference of 0.050%), and Nicaraguan (84.1%, a difference of 0.050%).
| Demographics | Rating | Rank | In Labor Force | Age 35-44 |
| Immigrants | Ecuador | 15.2 /100 | #211 | Poor 84.1% |
| Israelis | 14.0 /100 | #212 | Poor 84.1% |
| Bangladeshis | 13.7 /100 | #213 | Poor 84.1% |
| Immigrants | Barbados | 13.2 /100 | #214 | Poor 84.1% |
| Europeans | 12.2 /100 | #215 | Poor 84.1% |
| Nicaraguans | 12.1 /100 | #216 | Poor 84.1% |
| Immigrants | Norway | 11.7 /100 | #217 | Poor 84.1% |
| Immigrants | Nicaragua | 9.4 /100 | #218 | Tragic 84.1% |
| Sub-Saharan Africans | 9.3 /100 | #219 | Tragic 84.1% |
| French | 7.5 /100 | #220 | Tragic 84.0% |
| Icelanders | 6.7 /100 | #221 | Tragic 84.0% |
| Assyrians/Chaldeans/Syriacs | 6.6 /100 | #222 | Tragic 84.0% |
| Immigrants | Panama | 6.4 /100 | #223 | Tragic 84.0% |
| U.S. Virgin Islanders | 6.1 /100 | #224 | Tragic 84.0% |
| Immigrants | Burma/Myanmar | 6.1 /100 | #225 | Tragic 84.0% |