U.S. Virgin Islander vs Immigrants from Guyana Unemployment
COMPARE
U.S. Virgin Islander
Immigrants from Guyana
Unemployment
Unemployment Comparison
U.S. Virgin Islanders
Immigrants from Guyana
6.3%
UNEMPLOYMENT
0.0/ 100
METRIC RATING
295th/ 347
METRIC RANK
6.9%
UNEMPLOYMENT
0.0/ 100
METRIC RATING
321st/ 347
METRIC RANK
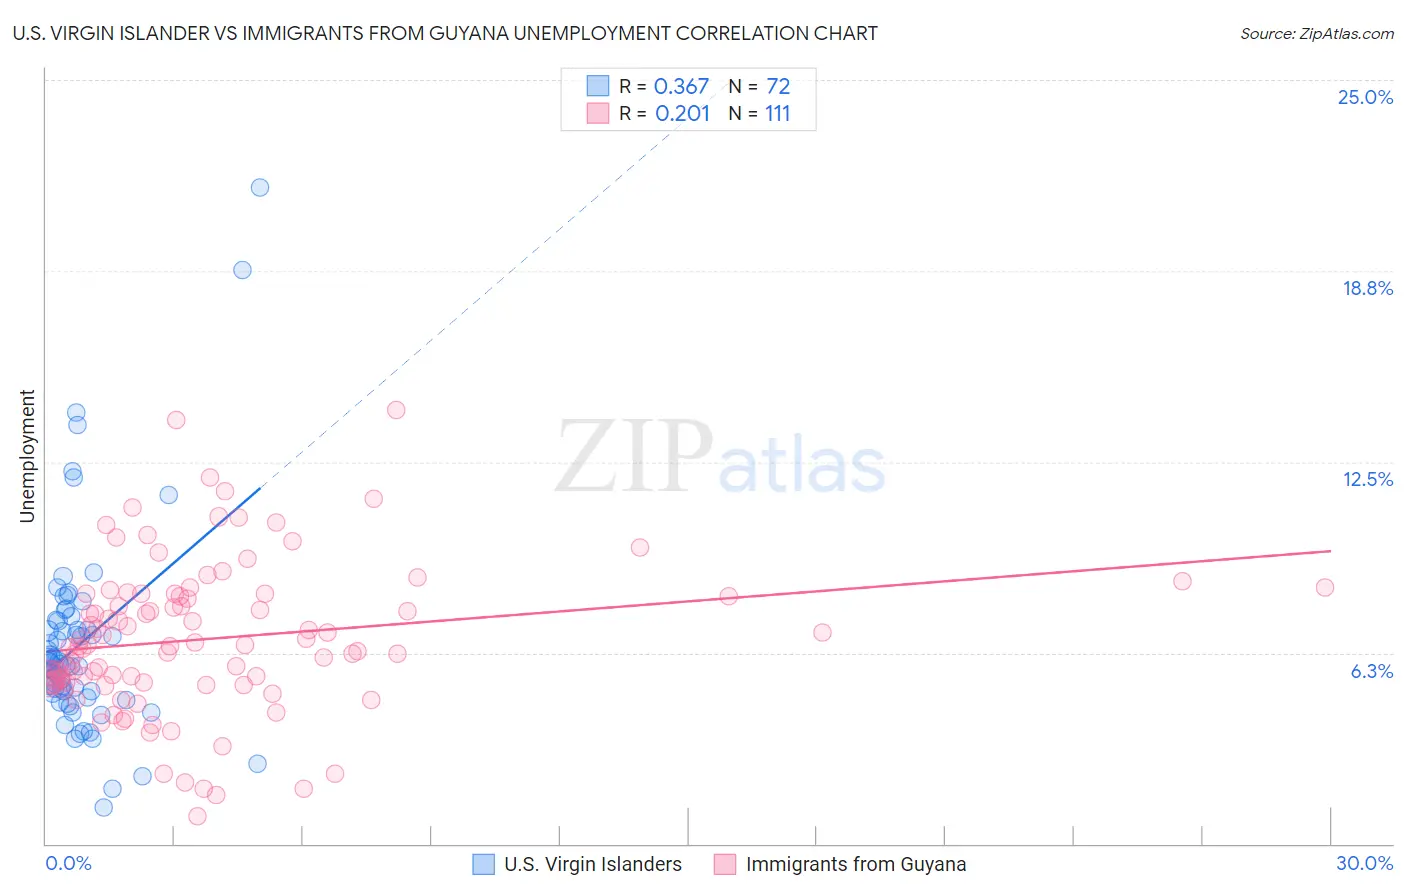
U.S. Virgin Islander vs Immigrants from Guyana Unemployment Correlation Chart
The statistical analysis conducted on geographies consisting of 87,515,102 people shows a mild positive correlation between the proportion of U.S. Virgin Islanders and unemployment in the United States with a correlation coefficient (R) of 0.367 and weighted average of 6.3%. Similarly, the statistical analysis conducted on geographies consisting of 183,677,376 people shows a weak positive correlation between the proportion of Immigrants from Guyana and unemployment in the United States with a correlation coefficient (R) of 0.201 and weighted average of 6.9%, a difference of 10.2%.
Unemployment Correlation Summary
| Measurement | U.S. Virgin Islander | Immigrants from Guyana |
| Minimum | 1.2% | 0.90% |
| Maximum | 21.5% | 14.2% |
| Range | 20.3% | 13.3% |
| Mean | 6.6% | 6.7% |
| Median | 5.9% | 6.5% |
| Interquartile 25% (IQ1) | 4.9% | 5.3% |
| Interquartile 75% (IQ3) | 7.3% | 8.2% |
| Interquartile Range (IQR) | 2.4% | 2.9% |
| Standard Deviation (Sample) | 3.3% | 2.5% |
| Standard Deviation (Population) | 3.3% | 2.5% |
Similar Demographics by Unemployment
Demographics Similar to U.S. Virgin Islanders by Unemployment
In terms of unemployment, the demographic groups most similar to U.S. Virgin Islanders are Immigrants from Ecuador (6.2%, a difference of 0.12%), Spanish American Indian (6.2%, a difference of 0.12%), Central American Indian (6.2%, a difference of 0.22%), Haitian (6.2%, a difference of 0.23%), and Ute (6.3%, a difference of 0.45%).
| Demographics | Rating | Rank | Unemployment |
| Ecuadorians | 0.0 /100 | #288 | Tragic 6.2% |
| Chippewa | 0.0 /100 | #289 | Tragic 6.2% |
| Senegalese | 0.0 /100 | #290 | Tragic 6.2% |
| Haitians | 0.0 /100 | #291 | Tragic 6.2% |
| Central American Indians | 0.0 /100 | #292 | Tragic 6.2% |
| Immigrants | Ecuador | 0.0 /100 | #293 | Tragic 6.2% |
| Spanish American Indians | 0.0 /100 | #294 | Tragic 6.2% |
| U.S. Virgin Islanders | 0.0 /100 | #295 | Tragic 6.3% |
| Ute | 0.0 /100 | #296 | Tragic 6.3% |
| Jamaicans | 0.0 /100 | #297 | Tragic 6.3% |
| Immigrants | Haiti | 0.0 /100 | #298 | Tragic 6.3% |
| Immigrants | West Indies | 0.0 /100 | #299 | Tragic 6.3% |
| Immigrants | Trinidad and Tobago | 0.0 /100 | #300 | Tragic 6.3% |
| Trinidadians and Tobagonians | 0.0 /100 | #301 | Tragic 6.3% |
| West Indians | 0.0 /100 | #302 | Tragic 6.4% |
Demographics Similar to Immigrants from Guyana by Unemployment
In terms of unemployment, the demographic groups most similar to Immigrants from Guyana are Immigrants from St. Vincent and the Grenadines (6.9%, a difference of 0.010%), Guyanese (6.9%, a difference of 0.040%), Immigrants from Grenada (6.9%, a difference of 0.36%), British West Indian (6.8%, a difference of 0.81%), and Immigrants from Cabo Verde (6.8%, a difference of 1.0%).
| Demographics | Rating | Rank | Unemployment |
| Blacks/African Americans | 0.0 /100 | #314 | Tragic 6.6% |
| Houma | 0.0 /100 | #315 | Tragic 6.7% |
| Immigrants | Dominica | 0.0 /100 | #316 | Tragic 6.7% |
| Shoshone | 0.0 /100 | #317 | Tragic 6.8% |
| Immigrants | Cabo Verde | 0.0 /100 | #318 | Tragic 6.8% |
| British West Indians | 0.0 /100 | #319 | Tragic 6.8% |
| Immigrants | St. Vincent and the Grenadines | 0.0 /100 | #320 | Tragic 6.9% |
| Immigrants | Guyana | 0.0 /100 | #321 | Tragic 6.9% |
| Guyanese | 0.0 /100 | #322 | Tragic 6.9% |
| Immigrants | Grenada | 0.0 /100 | #323 | Tragic 6.9% |
| Immigrants | Armenia | 0.0 /100 | #324 | Tragic 7.0% |
| Natives/Alaskans | 0.0 /100 | #325 | Tragic 7.0% |
| Paiute | 0.0 /100 | #326 | Tragic 7.1% |
| Pueblo | 0.0 /100 | #327 | Tragic 7.2% |
| Tsimshian | 0.0 /100 | #328 | Tragic 7.2% |