U.S. Virgin Islander vs Austrian 4 or more Vehicles in Household
COMPARE
U.S. Virgin Islander
Austrian
4 or more Vehicles in Household
4 or more Vehicles in Household Comparison
U.S. Virgin Islanders
Austrians
4.6%
4 OR MORE VEHICLES IN HOUSEHOLD
0.0/ 100
METRIC RATING
317th/ 347
METRIC RANK
6.8%
4 OR MORE VEHICLES IN HOUSEHOLD
94.1/ 100
METRIC RATING
125th/ 347
METRIC RANK
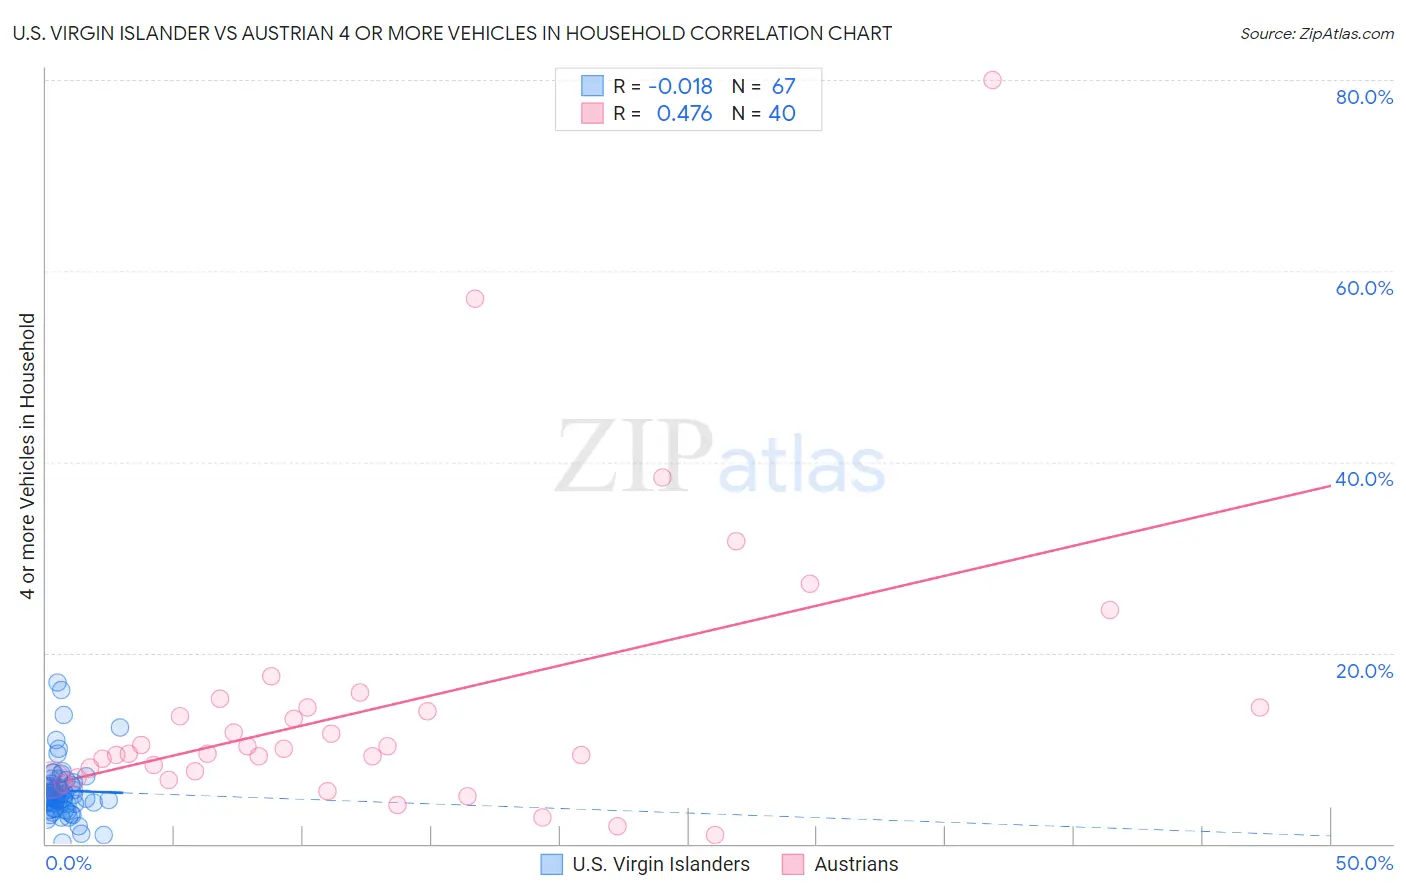
U.S. Virgin Islander vs Austrian 4 or more Vehicles in Household Correlation Chart
The statistical analysis conducted on geographies consisting of 87,207,044 people shows no correlation between the proportion of U.S. Virgin Islanders and percentage of households with 4 or more vehicles available in the United States with a correlation coefficient (R) of -0.018 and weighted average of 4.6%. Similarly, the statistical analysis conducted on geographies consisting of 450,167,430 people shows a moderate positive correlation between the proportion of Austrians and percentage of households with 4 or more vehicles available in the United States with a correlation coefficient (R) of 0.476 and weighted average of 6.8%, a difference of 45.8%.
4 or more Vehicles in Household Correlation Summary
| Measurement | U.S. Virgin Islander | Austrian |
| Minimum | 0.17% | 0.94% |
| Maximum | 16.9% | 80.0% |
| Range | 16.7% | 79.1% |
| Mean | 5.6% | 14.4% |
| Median | 5.0% | 9.7% |
| Interquartile 25% (IQ1) | 4.2% | 7.2% |
| Interquartile 75% (IQ3) | 6.3% | 14.3% |
| Interquartile Range (IQR) | 2.1% | 7.1% |
| Standard Deviation (Sample) | 3.0% | 14.9% |
| Standard Deviation (Population) | 3.0% | 14.7% |
Similar Demographics by 4 or more Vehicles in Household
Demographics Similar to U.S. Virgin Islanders by 4 or more Vehicles in Household
In terms of 4 or more vehicles in household, the demographic groups most similar to U.S. Virgin Islanders are Jamaican (4.6%, a difference of 0.24%), Haitian (4.6%, a difference of 0.89%), Puerto Rican (4.7%, a difference of 1.7%), Immigrants from Belarus (4.7%, a difference of 2.1%), and Immigrants from West Indies (4.7%, a difference of 2.2%).
| Demographics | Rating | Rank | 4 or more Vehicles in Household |
| Moroccans | 0.0 /100 | #310 | Tragic 4.9% |
| Houma | 0.0 /100 | #311 | Tragic 4.9% |
| Albanians | 0.0 /100 | #312 | Tragic 4.8% |
| Immigrants | Israel | 0.0 /100 | #313 | Tragic 4.8% |
| Immigrants | West Indies | 0.0 /100 | #314 | Tragic 4.7% |
| Immigrants | Belarus | 0.0 /100 | #315 | Tragic 4.7% |
| Puerto Ricans | 0.0 /100 | #316 | Tragic 4.7% |
| U.S. Virgin Islanders | 0.0 /100 | #317 | Tragic 4.6% |
| Jamaicans | 0.0 /100 | #318 | Tragic 4.6% |
| Haitians | 0.0 /100 | #319 | Tragic 4.6% |
| Immigrants | Haiti | 0.0 /100 | #320 | Tragic 4.5% |
| Ecuadorians | 0.0 /100 | #321 | Tragic 4.5% |
| Immigrants | Yemen | 0.0 /100 | #322 | Tragic 4.5% |
| Immigrants | Caribbean | 0.0 /100 | #323 | Tragic 4.4% |
| Soviet Union | 0.0 /100 | #324 | Tragic 4.4% |
Demographics Similar to Austrians by 4 or more Vehicles in Household
In terms of 4 or more vehicles in household, the demographic groups most similar to Austrians are Belgian (6.8%, a difference of 0.010%), Immigrants from Asia (6.8%, a difference of 0.10%), Immigrants from Korea (6.8%, a difference of 0.13%), Immigrants (6.8%, a difference of 0.19%), and Immigrants from Germany (6.8%, a difference of 0.26%).
| Demographics | Rating | Rank | 4 or more Vehicles in Household |
| French American Indians | 95.7 /100 | #118 | Exceptional 6.8% |
| Costa Ricans | 95.5 /100 | #119 | Exceptional 6.8% |
| Comanche | 94.8 /100 | #120 | Exceptional 6.8% |
| Immigrants | Germany | 94.7 /100 | #121 | Exceptional 6.8% |
| Immigrants | Nicaragua | 94.7 /100 | #122 | Exceptional 6.8% |
| Immigrants | Immigrants | 94.6 /100 | #123 | Exceptional 6.8% |
| Immigrants | Asia | 94.4 /100 | #124 | Exceptional 6.8% |
| Austrians | 94.1 /100 | #125 | Exceptional 6.8% |
| Belgians | 94.1 /100 | #126 | Exceptional 6.8% |
| Immigrants | Korea | 93.8 /100 | #127 | Exceptional 6.8% |
| Immigrants | Bolivia | 92.5 /100 | #128 | Exceptional 6.7% |
| Immigrants | England | 92.0 /100 | #129 | Exceptional 6.7% |
| Immigrants | Scotland | 89.0 /100 | #130 | Excellent 6.7% |
| Maltese | 88.4 /100 | #131 | Excellent 6.7% |
| Immigrants | Netherlands | 87.8 /100 | #132 | Excellent 6.6% |