U.S. Virgin Islander vs Apache Master's Degree
COMPARE
U.S. Virgin Islander
Apache
Master's Degree
Master's Degree Comparison
U.S. Virgin Islanders
Apache
13.1%
MASTER'S DEGREE
2.1/ 100
METRIC RATING
241st/ 347
METRIC RANK
11.0%
MASTER'S DEGREE
0.0/ 100
METRIC RATING
315th/ 347
METRIC RANK
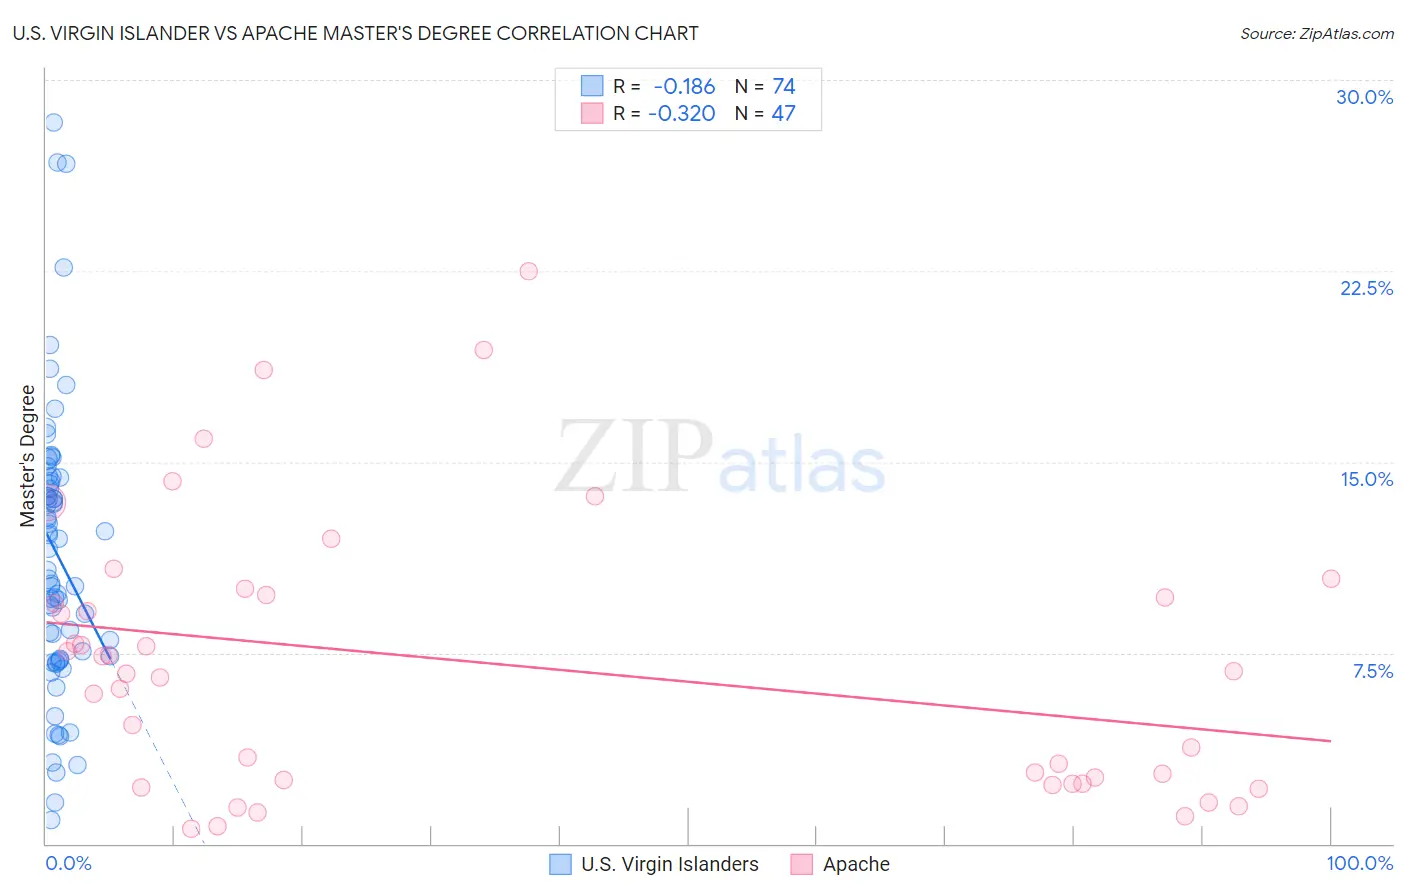
U.S. Virgin Islander vs Apache Master's Degree Correlation Chart
The statistical analysis conducted on geographies consisting of 87,520,164 people shows a poor negative correlation between the proportion of U.S. Virgin Islanders and percentage of population with at least master's degree education in the United States with a correlation coefficient (R) of -0.186 and weighted average of 13.1%. Similarly, the statistical analysis conducted on geographies consisting of 231,057,413 people shows a mild negative correlation between the proportion of Apache and percentage of population with at least master's degree education in the United States with a correlation coefficient (R) of -0.320 and weighted average of 11.0%, a difference of 19.3%.
Master's Degree Correlation Summary
| Measurement | U.S. Virgin Islander | Apache |
| Minimum | 0.93% | 0.59% |
| Maximum | 28.3% | 22.5% |
| Range | 27.4% | 21.9% |
| Mean | 11.4% | 7.0% |
| Median | 11.2% | 6.7% |
| Interquartile 25% (IQ1) | 7.2% | 2.3% |
| Interquartile 75% (IQ3) | 14.2% | 9.8% |
| Interquartile Range (IQR) | 7.0% | 7.4% |
| Standard Deviation (Sample) | 5.5% | 5.3% |
| Standard Deviation (Population) | 5.5% | 5.3% |
Similar Demographics by Master's Degree
Demographics Similar to U.S. Virgin Islanders by Master's Degree
In terms of master's degree, the demographic groups most similar to U.S. Virgin Islanders are Guamanian/Chamorro (13.1%, a difference of 0.14%), Spanish American (13.0%, a difference of 0.28%), Immigrants from Jamaica (13.0%, a difference of 0.32%), Delaware (13.0%, a difference of 0.70%), and Immigrants from Bahamas (12.9%, a difference of 1.4%).
| Demographics | Rating | Rank | Master's Degree |
| Immigrants | Burma/Myanmar | 5.0 /100 | #234 | Tragic 13.5% |
| German Russians | 4.5 /100 | #235 | Tragic 13.5% |
| Immigrants | Guyana | 4.4 /100 | #236 | Tragic 13.4% |
| Jamaicans | 4.1 /100 | #237 | Tragic 13.4% |
| Hmong | 4.0 /100 | #238 | Tragic 13.4% |
| Immigrants | Nonimmigrants | 3.4 /100 | #239 | Tragic 13.3% |
| Guamanians/Chamorros | 2.2 /100 | #240 | Tragic 13.1% |
| U.S. Virgin Islanders | 2.1 /100 | #241 | Tragic 13.1% |
| Spanish Americans | 1.9 /100 | #242 | Tragic 13.0% |
| Immigrants | Jamaica | 1.9 /100 | #243 | Tragic 13.0% |
| Delaware | 1.7 /100 | #244 | Tragic 13.0% |
| Immigrants | Bahamas | 1.4 /100 | #245 | Tragic 12.9% |
| Immigrants | Cambodia | 1.4 /100 | #246 | Tragic 12.9% |
| Iroquois | 1.4 /100 | #247 | Tragic 12.9% |
| Africans | 1.4 /100 | #248 | Tragic 12.9% |
Demographics Similar to Apache by Master's Degree
In terms of master's degree, the demographic groups most similar to Apache are Cajun (11.0%, a difference of 0.0%), Hispanic or Latino (10.9%, a difference of 0.34%), Yaqui (11.0%, a difference of 0.40%), Choctaw (11.0%, a difference of 0.58%), and Seminole (11.0%, a difference of 0.67%).
| Demographics | Rating | Rank | Master's Degree |
| Puerto Ricans | 0.0 /100 | #308 | Tragic 11.2% |
| Puget Sound Salish | 0.0 /100 | #309 | Tragic 11.1% |
| Shoshone | 0.0 /100 | #310 | Tragic 11.1% |
| Seminole | 0.0 /100 | #311 | Tragic 11.0% |
| Choctaw | 0.0 /100 | #312 | Tragic 11.0% |
| Yaqui | 0.0 /100 | #313 | Tragic 11.0% |
| Cajuns | 0.0 /100 | #314 | Tragic 11.0% |
| Apache | 0.0 /100 | #315 | Tragic 11.0% |
| Hispanics or Latinos | 0.0 /100 | #316 | Tragic 10.9% |
| Hopi | 0.0 /100 | #317 | Tragic 10.9% |
| Immigrants | Cuba | 0.0 /100 | #318 | Tragic 10.9% |
| Kiowa | 0.0 /100 | #319 | Tragic 10.8% |
| Immigrants | Micronesia | 0.0 /100 | #320 | Tragic 10.8% |
| Pennsylvania Germans | 0.0 /100 | #321 | Tragic 10.7% |
| Sioux | 0.0 /100 | #322 | Tragic 10.7% |