U.S. Virgin Islander vs Immigrants from Kenya Female Poverty
COMPARE
U.S. Virgin Islander
Immigrants from Kenya
Female Poverty
Female Poverty Comparison
U.S. Virgin Islanders
Immigrants from Kenya
17.3%
FEMALE POVERTY
0.0/ 100
METRIC RATING
315th/ 347
METRIC RANK
13.9%
FEMALE POVERTY
21.1/ 100
METRIC RATING
201st/ 347
METRIC RANK
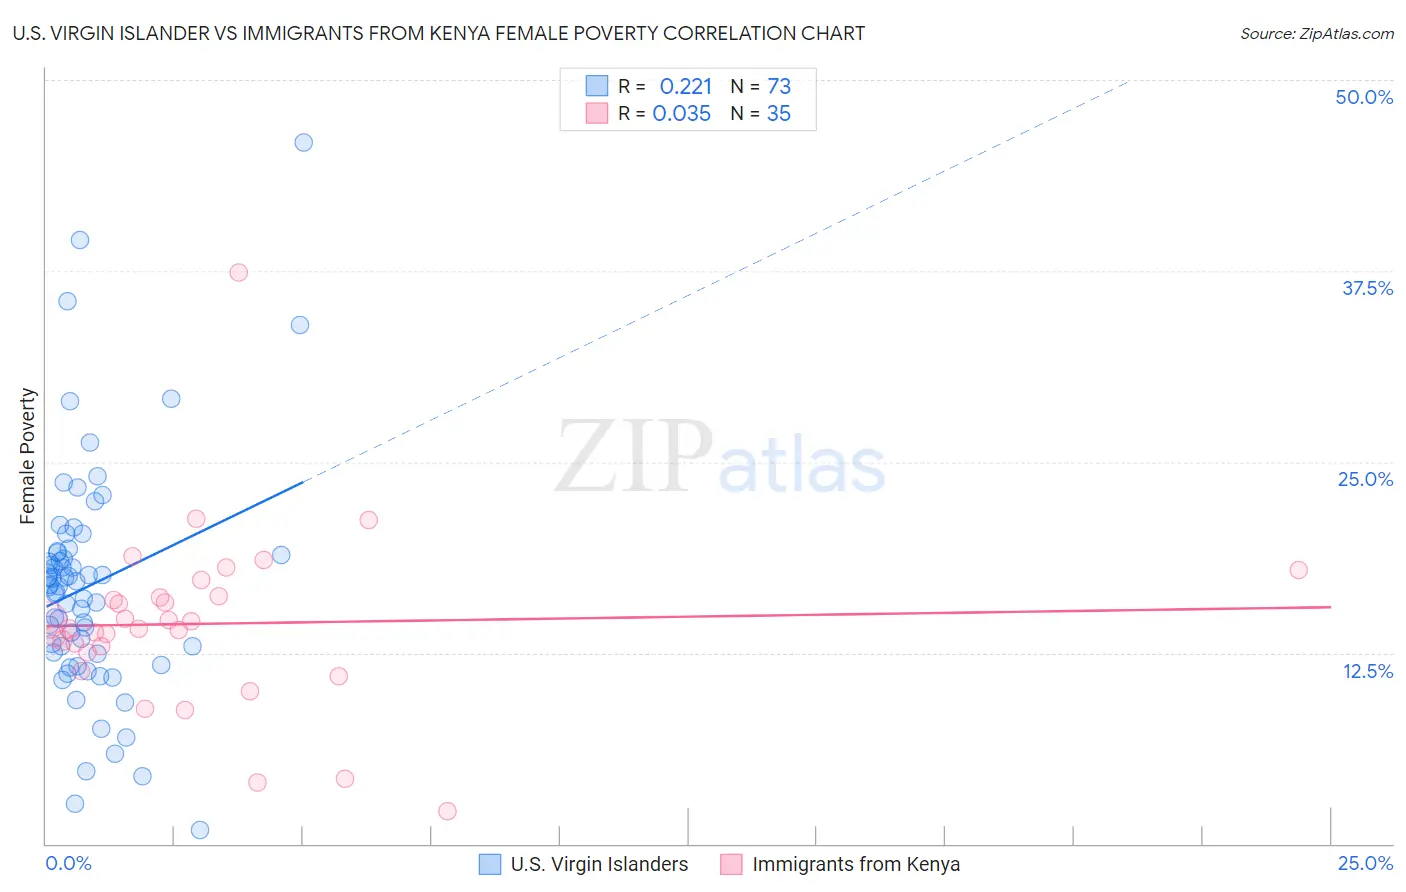
U.S. Virgin Islander vs Immigrants from Kenya Female Poverty Correlation Chart
The statistical analysis conducted on geographies consisting of 87,511,950 people shows a weak positive correlation between the proportion of U.S. Virgin Islanders and poverty level among females in the United States with a correlation coefficient (R) of 0.221 and weighted average of 17.3%. Similarly, the statistical analysis conducted on geographies consisting of 217,949,834 people shows no correlation between the proportion of Immigrants from Kenya and poverty level among females in the United States with a correlation coefficient (R) of 0.035 and weighted average of 13.9%, a difference of 24.8%.
Female Poverty Correlation Summary
| Measurement | U.S. Virgin Islander | Immigrants from Kenya |
| Minimum | 0.93% | 2.1% |
| Maximum | 45.9% | 37.4% |
| Range | 45.0% | 35.3% |
| Mean | 16.9% | 14.4% |
| Median | 16.8% | 14.1% |
| Interquartile 25% (IQ1) | 12.5% | 12.5% |
| Interquartile 75% (IQ3) | 19.1% | 16.2% |
| Interquartile Range (IQR) | 6.6% | 3.7% |
| Standard Deviation (Sample) | 7.7% | 5.9% |
| Standard Deviation (Population) | 7.6% | 5.8% |
Similar Demographics by Female Poverty
Demographics Similar to U.S. Virgin Islanders by Female Poverty
In terms of female poverty, the demographic groups most similar to U.S. Virgin Islanders are Honduran (17.4%, a difference of 0.30%), Immigrants from Congo (17.4%, a difference of 0.49%), Ute (17.5%, a difference of 0.82%), Cajun (17.5%, a difference of 0.83%), and Immigrants from Dominica (17.5%, a difference of 0.91%).
| Demographics | Rating | Rank | Female Poverty |
| Africans | 0.0 /100 | #308 | Tragic 16.9% |
| Immigrants | Mexico | 0.0 /100 | #309 | Tragic 17.0% |
| Creek | 0.0 /100 | #310 | Tragic 17.0% |
| Immigrants | Guatemala | 0.0 /100 | #311 | Tragic 17.0% |
| Immigrants | Somalia | 0.0 /100 | #312 | Tragic 17.0% |
| British West Indians | 0.0 /100 | #313 | Tragic 17.0% |
| Dutch West Indians | 0.0 /100 | #314 | Tragic 17.1% |
| U.S. Virgin Islanders | 0.0 /100 | #315 | Tragic 17.3% |
| Hondurans | 0.0 /100 | #316 | Tragic 17.4% |
| Immigrants | Congo | 0.0 /100 | #317 | Tragic 17.4% |
| Ute | 0.0 /100 | #318 | Tragic 17.5% |
| Cajuns | 0.0 /100 | #319 | Tragic 17.5% |
| Immigrants | Dominica | 0.0 /100 | #320 | Tragic 17.5% |
| Arapaho | 0.0 /100 | #321 | Tragic 17.5% |
| Menominee | 0.0 /100 | #322 | Tragic 17.6% |
Demographics Similar to Immigrants from Kenya by Female Poverty
In terms of female poverty, the demographic groups most similar to Immigrants from Kenya are Hmong (13.9%, a difference of 0.010%), Spanish (13.9%, a difference of 0.040%), Immigrants from Western Asia (13.9%, a difference of 0.060%), Spaniard (13.9%, a difference of 0.33%), and Immigrants from Lebanon (13.8%, a difference of 0.59%).
| Demographics | Rating | Rank | Female Poverty |
| Delaware | 31.1 /100 | #194 | Fair 13.7% |
| Immigrants | South America | 30.6 /100 | #195 | Fair 13.7% |
| South American Indians | 28.9 /100 | #196 | Fair 13.7% |
| Arabs | 28.6 /100 | #197 | Fair 13.7% |
| Immigrants | Uganda | 28.5 /100 | #198 | Fair 13.7% |
| Immigrants | Lebanon | 25.6 /100 | #199 | Fair 13.8% |
| Spanish | 21.4 /100 | #200 | Fair 13.9% |
| Immigrants | Kenya | 21.1 /100 | #201 | Fair 13.9% |
| Hmong | 21.1 /100 | #202 | Fair 13.9% |
| Immigrants | Western Asia | 20.7 /100 | #203 | Fair 13.9% |
| Spaniards | 18.9 /100 | #204 | Poor 13.9% |
| Ugandans | 15.4 /100 | #205 | Poor 14.0% |
| Immigrants | Uruguay | 14.0 /100 | #206 | Poor 14.0% |
| Immigrants | Eastern Africa | 9.0 /100 | #207 | Tragic 14.2% |
| Immigrants | Azores | 7.9 /100 | #208 | Tragic 14.2% |