Uruguayan vs Burmese Single Father Poverty
COMPARE
Uruguayan
Burmese
Single Father Poverty
Single Father Poverty Comparison
Uruguayans
Burmese
15.9%
SINGLE FATHER POVERTY
92.1/ 100
METRIC RATING
120th/ 347
METRIC RANK
15.5%
SINGLE FATHER POVERTY
99.0/ 100
METRIC RATING
88th/ 347
METRIC RANK
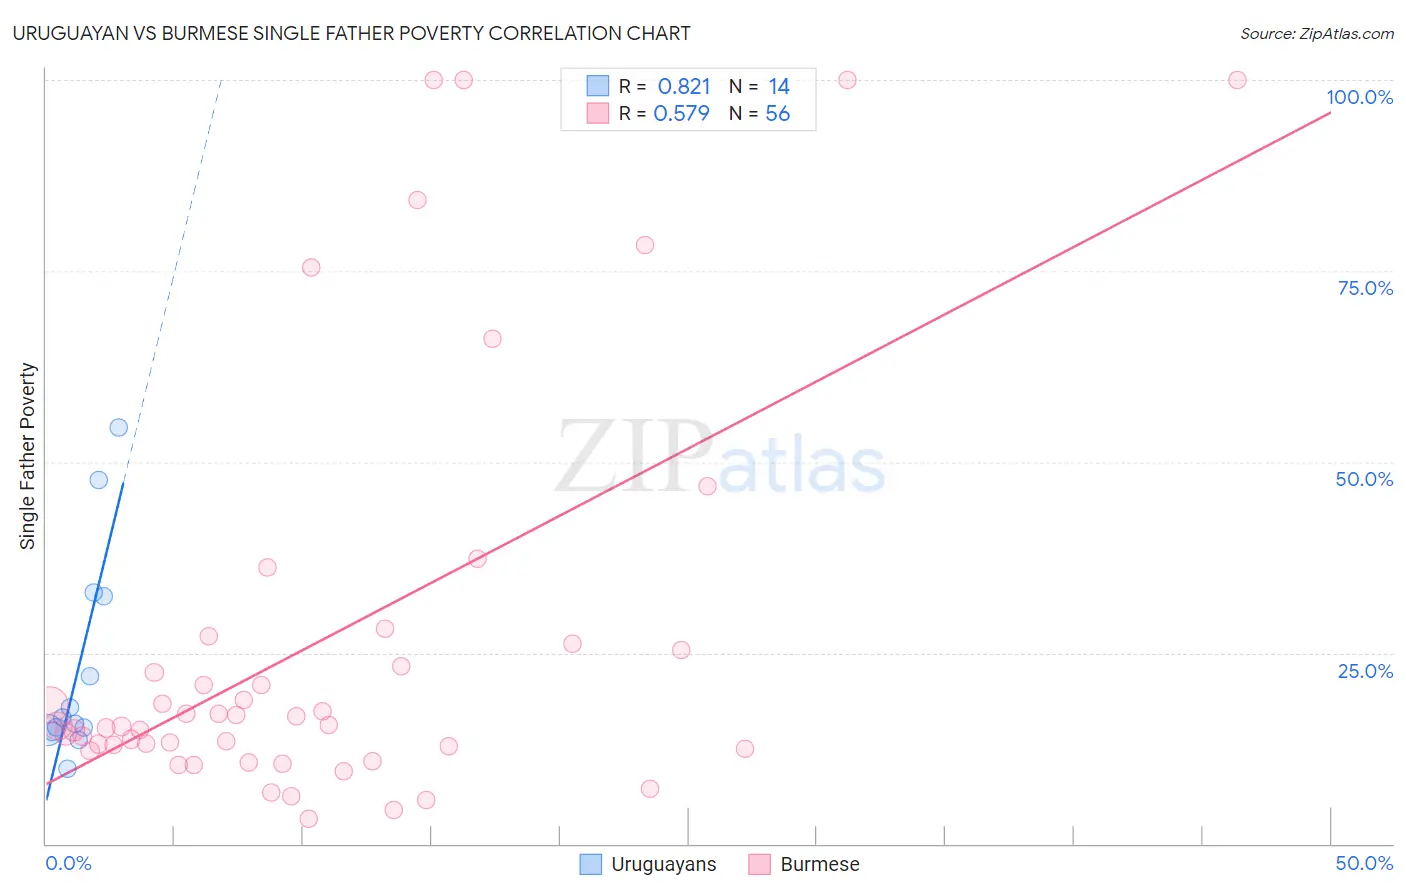
Uruguayan vs Burmese Single Father Poverty Correlation Chart
The statistical analysis conducted on geographies consisting of 126,833,155 people shows a very strong positive correlation between the proportion of Uruguayans and poverty level among single fathers in the United States with a correlation coefficient (R) of 0.821 and weighted average of 15.9%. Similarly, the statistical analysis conducted on geographies consisting of 355,001,827 people shows a substantial positive correlation between the proportion of Burmese and poverty level among single fathers in the United States with a correlation coefficient (R) of 0.579 and weighted average of 15.5%, a difference of 2.5%.
Single Father Poverty Correlation Summary
| Measurement | Uruguayan | Burmese |
| Minimum | 9.8% | 3.2% |
| Maximum | 54.5% | 100.0% |
| Range | 44.7% | 96.8% |
| Mean | 23.1% | 26.6% |
| Median | 16.1% | 15.4% |
| Interquartile 25% (IQ1) | 15.0% | 12.7% |
| Interquartile 75% (IQ3) | 32.4% | 25.9% |
| Interquartile Range (IQR) | 17.4% | 13.2% |
| Standard Deviation (Sample) | 13.7% | 26.9% |
| Standard Deviation (Population) | 13.2% | 26.7% |
Similar Demographics by Single Father Poverty
Demographics Similar to Uruguayans by Single Father Poverty
In terms of single father poverty, the demographic groups most similar to Uruguayans are Immigrants (15.9%, a difference of 0.020%), Immigrants from Belarus (15.8%, a difference of 0.060%), Immigrants from Eastern Europe (15.8%, a difference of 0.070%), Sudanese (15.9%, a difference of 0.080%), and Immigrants from Colombia (15.8%, a difference of 0.090%).
| Demographics | Rating | Rank | Single Father Poverty |
| Danes | 94.5 /100 | #113 | Exceptional 15.8% |
| Argentineans | 94.4 /100 | #114 | Exceptional 15.8% |
| Immigrants | Thailand | 93.6 /100 | #115 | Exceptional 15.8% |
| Immigrants | Argentina | 92.8 /100 | #116 | Exceptional 15.8% |
| Immigrants | Colombia | 92.6 /100 | #117 | Exceptional 15.8% |
| Immigrants | Eastern Europe | 92.5 /100 | #118 | Exceptional 15.8% |
| Immigrants | Belarus | 92.4 /100 | #119 | Exceptional 15.8% |
| Uruguayans | 92.1 /100 | #120 | Exceptional 15.9% |
| Immigrants | Immigrants | 91.9 /100 | #121 | Exceptional 15.9% |
| Sudanese | 91.6 /100 | #122 | Exceptional 15.9% |
| Palestinians | 91.3 /100 | #123 | Exceptional 15.9% |
| Immigrants | Panama | 91.3 /100 | #124 | Exceptional 15.9% |
| Iraqis | 91.2 /100 | #125 | Exceptional 15.9% |
| Hmong | 91.1 /100 | #126 | Exceptional 15.9% |
| Immigrants | Liberia | 91.1 /100 | #127 | Exceptional 15.9% |
Demographics Similar to Burmese by Single Father Poverty
In terms of single father poverty, the demographic groups most similar to Burmese are Brazilian (15.5%, a difference of 0.030%), Immigrants from Russia (15.5%, a difference of 0.040%), Immigrants from Korea (15.5%, a difference of 0.060%), Immigrants from Oceania (15.4%, a difference of 0.16%), and Peruvian (15.4%, a difference of 0.28%).
| Demographics | Rating | Rank | Single Father Poverty |
| Immigrants | Congo | 99.4 /100 | #81 | Exceptional 15.4% |
| Immigrants | Ukraine | 99.4 /100 | #82 | Exceptional 15.4% |
| Chinese | 99.3 /100 | #83 | Exceptional 15.4% |
| Peruvians | 99.2 /100 | #84 | Exceptional 15.4% |
| Immigrants | Oceania | 99.1 /100 | #85 | Exceptional 15.4% |
| Immigrants | Russia | 99.0 /100 | #86 | Exceptional 15.5% |
| Brazilians | 99.0 /100 | #87 | Exceptional 15.5% |
| Burmese | 99.0 /100 | #88 | Exceptional 15.5% |
| Immigrants | Korea | 99.0 /100 | #89 | Exceptional 15.5% |
| Mexican American Indians | 98.7 /100 | #90 | Exceptional 15.5% |
| Immigrants | Romania | 98.6 /100 | #91 | Exceptional 15.5% |
| Immigrants | Serbia | 98.5 /100 | #92 | Exceptional 15.5% |
| Basques | 98.4 /100 | #93 | Exceptional 15.5% |
| Immigrants | Uruguay | 98.2 /100 | #94 | Exceptional 15.6% |
| Immigrants | Kazakhstan | 98.2 /100 | #95 | Exceptional 15.6% |