Uruguayan vs Blackfeet Single Father Poverty
COMPARE
Uruguayan
Blackfeet
Single Father Poverty
Single Father Poverty Comparison
Uruguayans
Blackfeet
15.9%
SINGLE FATHER POVERTY
92.1/ 100
METRIC RATING
120th/ 347
METRIC RANK
18.5%
SINGLE FATHER POVERTY
0.0/ 100
METRIC RATING
305th/ 347
METRIC RANK
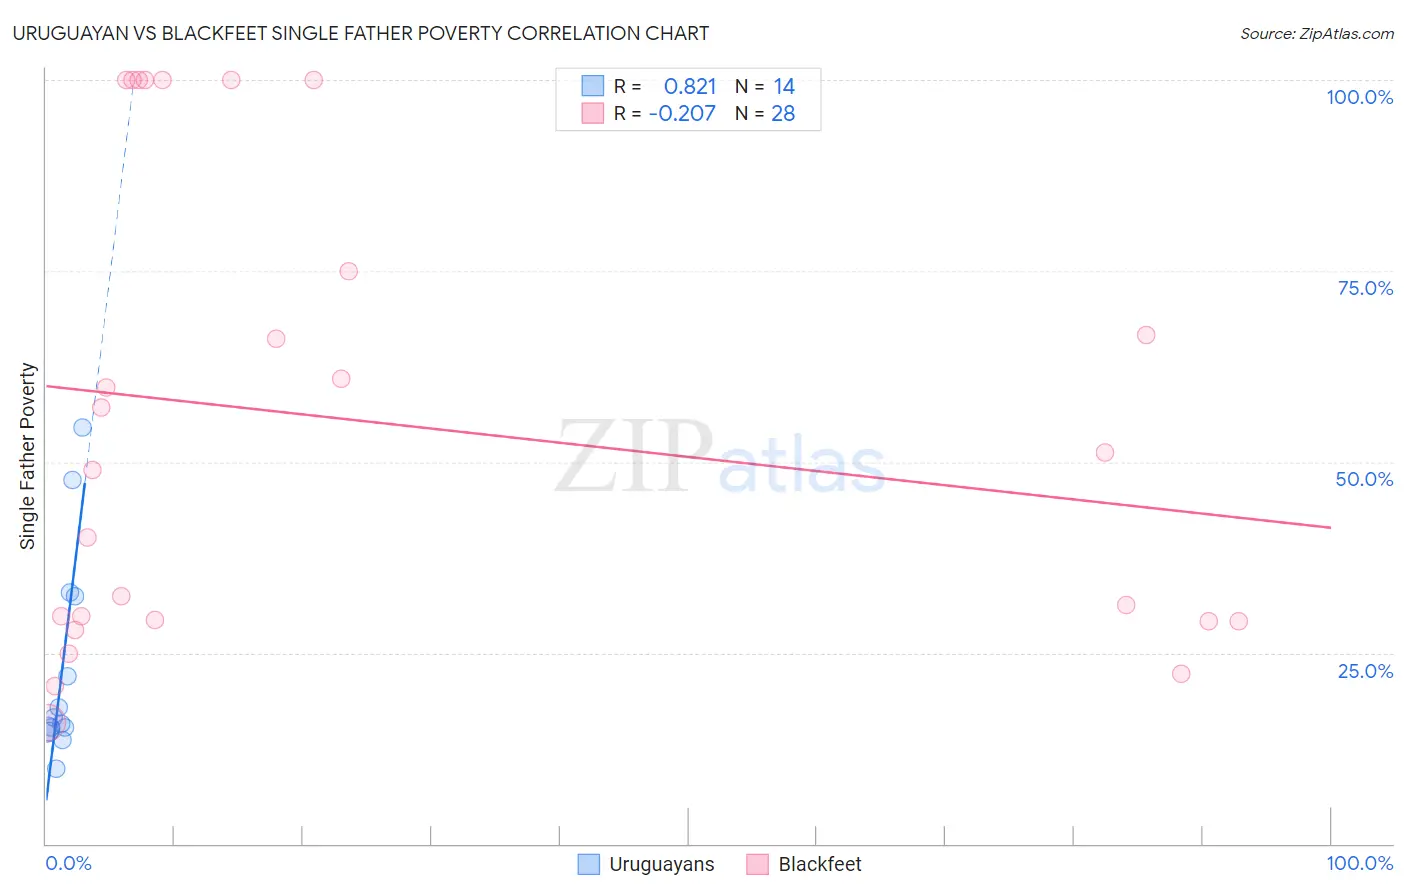
Uruguayan vs Blackfeet Single Father Poverty Correlation Chart
The statistical analysis conducted on geographies consisting of 126,833,155 people shows a very strong positive correlation between the proportion of Uruguayans and poverty level among single fathers in the United States with a correlation coefficient (R) of 0.821 and weighted average of 15.9%. Similarly, the statistical analysis conducted on geographies consisting of 259,730,501 people shows a weak negative correlation between the proportion of Blackfeet and poverty level among single fathers in the United States with a correlation coefficient (R) of -0.207 and weighted average of 18.5%, a difference of 16.8%.
Single Father Poverty Correlation Summary
| Measurement | Uruguayan | Blackfeet |
| Minimum | 9.8% | 15.8% |
| Maximum | 54.5% | 100.0% |
| Range | 44.7% | 84.2% |
| Mean | 23.1% | 55.3% |
| Median | 16.1% | 50.0% |
| Interquartile 25% (IQ1) | 15.0% | 29.2% |
| Interquartile 75% (IQ3) | 32.4% | 87.5% |
| Interquartile Range (IQR) | 17.4% | 58.3% |
| Standard Deviation (Sample) | 13.7% | 30.4% |
| Standard Deviation (Population) | 13.2% | 29.8% |
Similar Demographics by Single Father Poverty
Demographics Similar to Uruguayans by Single Father Poverty
In terms of single father poverty, the demographic groups most similar to Uruguayans are Immigrants (15.9%, a difference of 0.020%), Immigrants from Belarus (15.8%, a difference of 0.060%), Immigrants from Eastern Europe (15.8%, a difference of 0.070%), Sudanese (15.9%, a difference of 0.080%), and Immigrants from Colombia (15.8%, a difference of 0.090%).
| Demographics | Rating | Rank | Single Father Poverty |
| Danes | 94.5 /100 | #113 | Exceptional 15.8% |
| Argentineans | 94.4 /100 | #114 | Exceptional 15.8% |
| Immigrants | Thailand | 93.6 /100 | #115 | Exceptional 15.8% |
| Immigrants | Argentina | 92.8 /100 | #116 | Exceptional 15.8% |
| Immigrants | Colombia | 92.6 /100 | #117 | Exceptional 15.8% |
| Immigrants | Eastern Europe | 92.5 /100 | #118 | Exceptional 15.8% |
| Immigrants | Belarus | 92.4 /100 | #119 | Exceptional 15.8% |
| Uruguayans | 92.1 /100 | #120 | Exceptional 15.9% |
| Immigrants | Immigrants | 91.9 /100 | #121 | Exceptional 15.9% |
| Sudanese | 91.6 /100 | #122 | Exceptional 15.9% |
| Palestinians | 91.3 /100 | #123 | Exceptional 15.9% |
| Immigrants | Panama | 91.3 /100 | #124 | Exceptional 15.9% |
| Iraqis | 91.2 /100 | #125 | Exceptional 15.9% |
| Hmong | 91.1 /100 | #126 | Exceptional 15.9% |
| Immigrants | Liberia | 91.1 /100 | #127 | Exceptional 15.9% |
Demographics Similar to Blackfeet by Single Father Poverty
In terms of single father poverty, the demographic groups most similar to Blackfeet are Ute (18.5%, a difference of 0.050%), Celtic (18.5%, a difference of 0.19%), Scotch-Irish (18.6%, a difference of 0.22%), Comanche (18.5%, a difference of 0.23%), and French Canadian (18.6%, a difference of 0.26%).
| Demographics | Rating | Rank | Single Father Poverty |
| Africans | 0.0 /100 | #298 | Tragic 18.3% |
| Whites/Caucasians | 0.0 /100 | #299 | Tragic 18.4% |
| Immigrants | Dominican Republic | 0.0 /100 | #300 | Tragic 18.4% |
| Hungarians | 0.0 /100 | #301 | Tragic 18.5% |
| Comanche | 0.0 /100 | #302 | Tragic 18.5% |
| Celtics | 0.0 /100 | #303 | Tragic 18.5% |
| Ute | 0.0 /100 | #304 | Tragic 18.5% |
| Blackfeet | 0.0 /100 | #305 | Tragic 18.5% |
| Scotch-Irish | 0.0 /100 | #306 | Tragic 18.6% |
| French Canadians | 0.0 /100 | #307 | Tragic 18.6% |
| Ottawa | 0.0 /100 | #308 | Tragic 18.6% |
| Immigrants | Micronesia | 0.0 /100 | #309 | Tragic 18.6% |
| Chippewa | 0.0 /100 | #310 | Tragic 18.8% |
| Immigrants | Nonimmigrants | 0.0 /100 | #311 | Tragic 18.8% |
| Immigrants | Dominica | 0.0 /100 | #312 | Tragic 18.9% |