Uruguayan vs Immigrants from Honduras Single Father Poverty
COMPARE
Uruguayan
Immigrants from Honduras
Single Father Poverty
Single Father Poverty Comparison
Uruguayans
Immigrants from Honduras
15.9%
SINGLE FATHER POVERTY
92.1/ 100
METRIC RATING
120th/ 347
METRIC RANK
17.1%
SINGLE FATHER POVERTY
0.9/ 100
METRIC RATING
254th/ 347
METRIC RANK
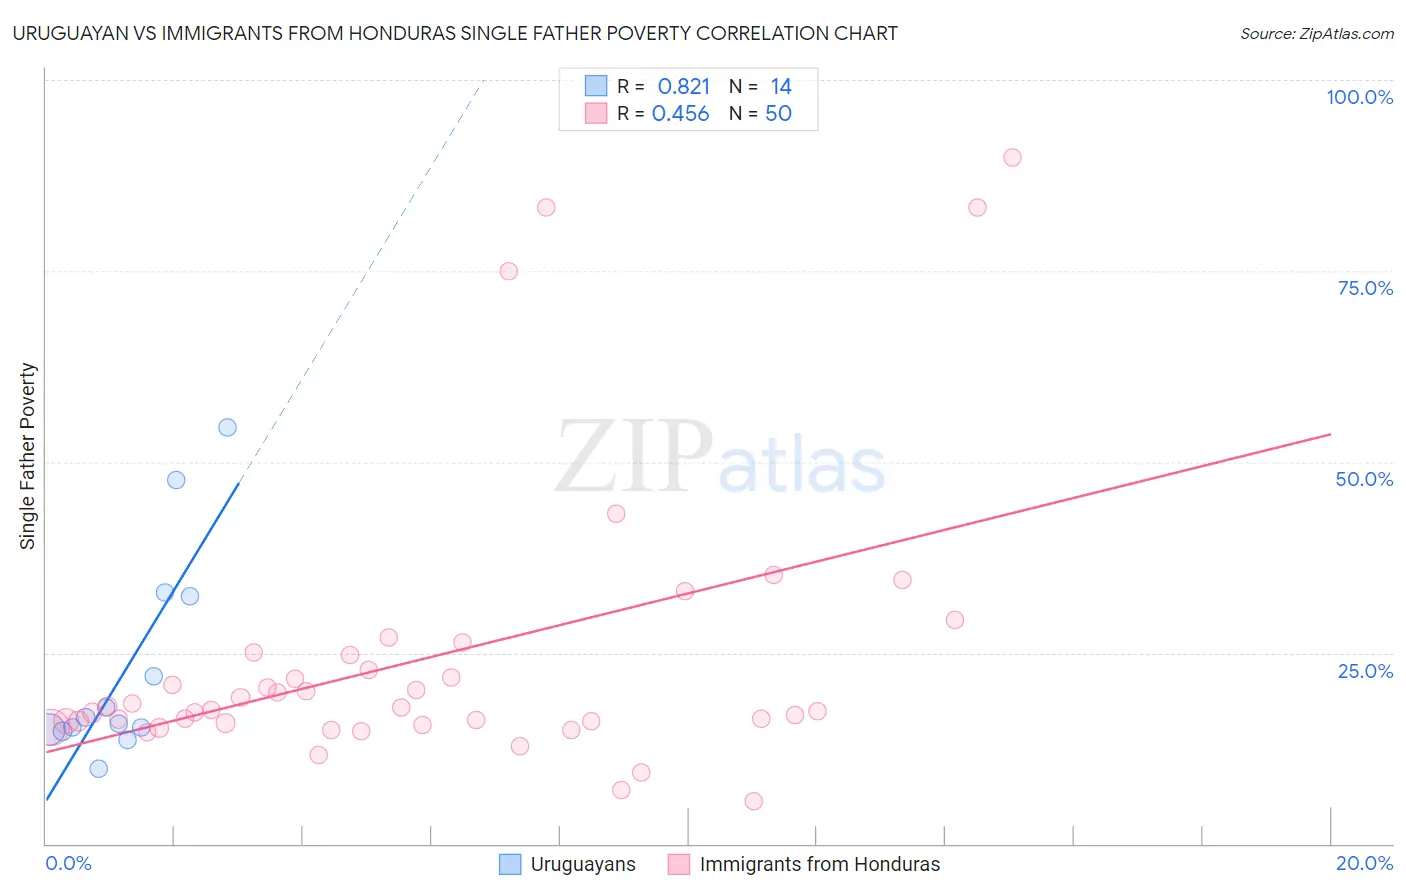
Uruguayan vs Immigrants from Honduras Single Father Poverty Correlation Chart
The statistical analysis conducted on geographies consisting of 126,833,155 people shows a very strong positive correlation between the proportion of Uruguayans and poverty level among single fathers in the United States with a correlation coefficient (R) of 0.821 and weighted average of 15.9%. Similarly, the statistical analysis conducted on geographies consisting of 269,347,803 people shows a moderate positive correlation between the proportion of Immigrants from Honduras and poverty level among single fathers in the United States with a correlation coefficient (R) of 0.456 and weighted average of 17.1%, a difference of 8.1%.
Single Father Poverty Correlation Summary
| Measurement | Uruguayan | Immigrants from Honduras |
| Minimum | 9.8% | 5.5% |
| Maximum | 54.5% | 89.9% |
| Range | 44.7% | 84.4% |
| Mean | 23.1% | 24.3% |
| Median | 16.1% | 17.6% |
| Interquartile 25% (IQ1) | 15.0% | 15.8% |
| Interquartile 75% (IQ3) | 32.4% | 24.8% |
| Interquartile Range (IQR) | 17.4% | 9.0% |
| Standard Deviation (Sample) | 13.7% | 18.8% |
| Standard Deviation (Population) | 13.2% | 18.6% |
Similar Demographics by Single Father Poverty
Demographics Similar to Uruguayans by Single Father Poverty
In terms of single father poverty, the demographic groups most similar to Uruguayans are Immigrants (15.9%, a difference of 0.020%), Immigrants from Belarus (15.8%, a difference of 0.060%), Immigrants from Eastern Europe (15.8%, a difference of 0.070%), Sudanese (15.9%, a difference of 0.080%), and Immigrants from Colombia (15.8%, a difference of 0.090%).
| Demographics | Rating | Rank | Single Father Poverty |
| Danes | 94.5 /100 | #113 | Exceptional 15.8% |
| Argentineans | 94.4 /100 | #114 | Exceptional 15.8% |
| Immigrants | Thailand | 93.6 /100 | #115 | Exceptional 15.8% |
| Immigrants | Argentina | 92.8 /100 | #116 | Exceptional 15.8% |
| Immigrants | Colombia | 92.6 /100 | #117 | Exceptional 15.8% |
| Immigrants | Eastern Europe | 92.5 /100 | #118 | Exceptional 15.8% |
| Immigrants | Belarus | 92.4 /100 | #119 | Exceptional 15.8% |
| Uruguayans | 92.1 /100 | #120 | Exceptional 15.9% |
| Immigrants | Immigrants | 91.9 /100 | #121 | Exceptional 15.9% |
| Sudanese | 91.6 /100 | #122 | Exceptional 15.9% |
| Palestinians | 91.3 /100 | #123 | Exceptional 15.9% |
| Immigrants | Panama | 91.3 /100 | #124 | Exceptional 15.9% |
| Iraqis | 91.2 /100 | #125 | Exceptional 15.9% |
| Hmong | 91.1 /100 | #126 | Exceptional 15.9% |
| Immigrants | Liberia | 91.1 /100 | #127 | Exceptional 15.9% |
Demographics Similar to Immigrants from Honduras by Single Father Poverty
In terms of single father poverty, the demographic groups most similar to Immigrants from Honduras are Croatian (17.1%, a difference of 0.12%), Cree (17.1%, a difference of 0.12%), Sierra Leonean (17.2%, a difference of 0.17%), Immigrants from Haiti (17.2%, a difference of 0.19%), and Luxembourger (17.1%, a difference of 0.22%).
| Demographics | Rating | Rank | Single Father Poverty |
| Greeks | 1.3 /100 | #247 | Tragic 17.1% |
| Czechoslovakians | 1.3 /100 | #248 | Tragic 17.1% |
| Canadians | 1.3 /100 | #249 | Tragic 17.1% |
| Austrians | 1.1 /100 | #250 | Tragic 17.1% |
| Luxembourgers | 1.1 /100 | #251 | Tragic 17.1% |
| Croatians | 1.0 /100 | #252 | Tragic 17.1% |
| Cree | 1.0 /100 | #253 | Tragic 17.1% |
| Immigrants | Honduras | 0.9 /100 | #254 | Tragic 17.1% |
| Sierra Leoneans | 0.8 /100 | #255 | Tragic 17.2% |
| Immigrants | Haiti | 0.8 /100 | #256 | Tragic 17.2% |
| Immigrants | Albania | 0.7 /100 | #257 | Tragic 17.2% |
| Albanians | 0.7 /100 | #258 | Tragic 17.2% |
| Immigrants | Jamaica | 0.7 /100 | #259 | Tragic 17.2% |
| Spaniards | 0.6 /100 | #260 | Tragic 17.2% |
| Swiss | 0.5 /100 | #261 | Tragic 17.3% |