Uruguayan vs Immigrants from Sudan 1 or more Vehicles in Household
COMPARE
Uruguayan
Immigrants from Sudan
1 or more Vehicles in Household
1 or more Vehicles in Household Comparison
Uruguayans
Immigrants from Sudan
88.8%
1 OR MORE VEHICLES IN HOUSEHOLD
7.0/ 100
METRIC RATING
222nd/ 347
METRIC RANK
89.7%
1 OR MORE VEHICLES IN HOUSEHOLD
47.1/ 100
METRIC RATING
176th/ 347
METRIC RANK
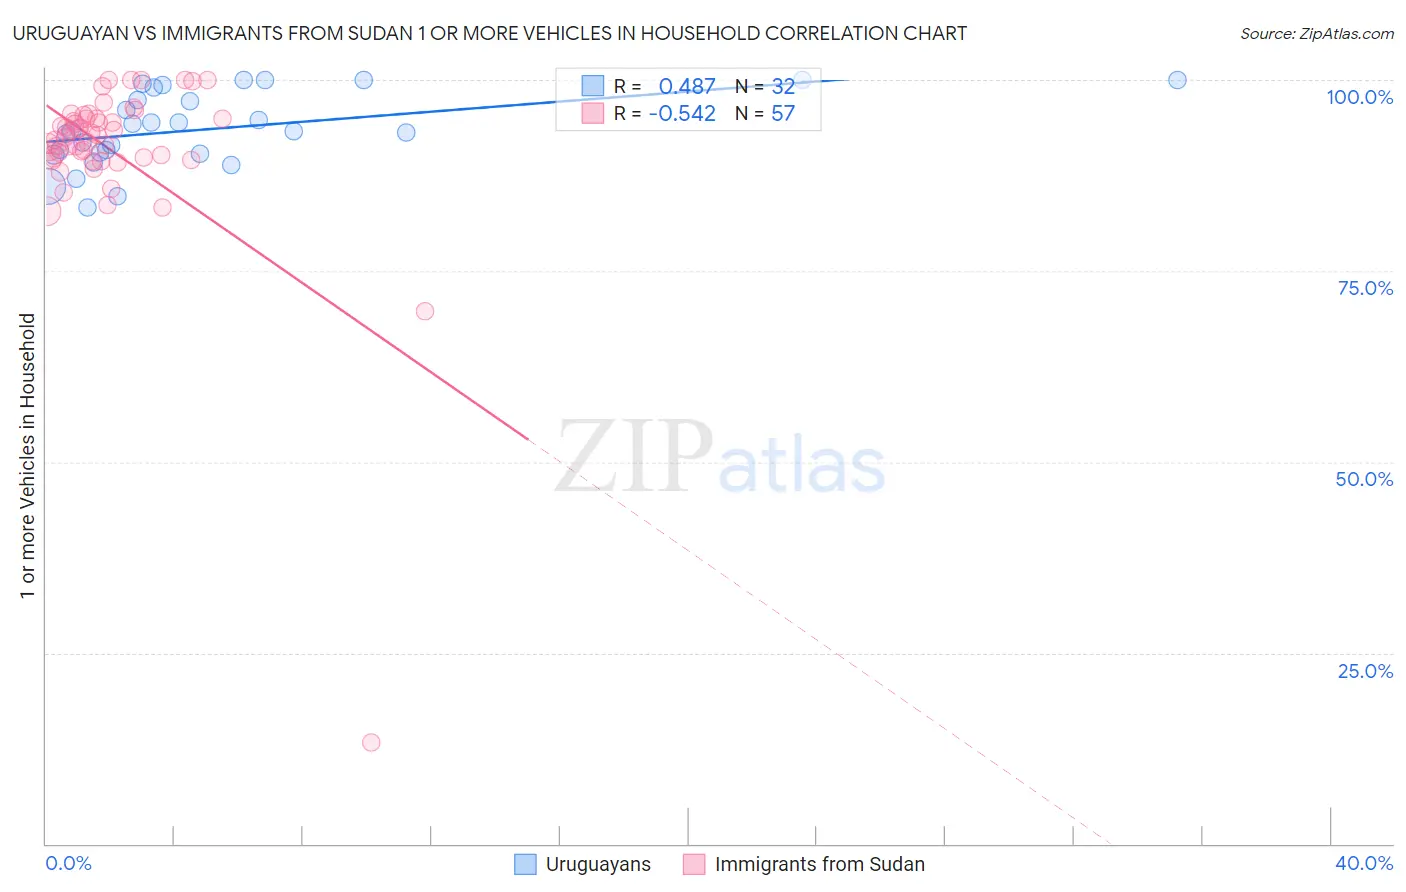
Uruguayan vs Immigrants from Sudan 1 or more Vehicles in Household Correlation Chart
The statistical analysis conducted on geographies consisting of 144,759,773 people shows a moderate positive correlation between the proportion of Uruguayans and percentage of households with 1 or more vehicles available in the United States with a correlation coefficient (R) of 0.487 and weighted average of 88.8%. Similarly, the statistical analysis conducted on geographies consisting of 118,959,591 people shows a substantial negative correlation between the proportion of Immigrants from Sudan and percentage of households with 1 or more vehicles available in the United States with a correlation coefficient (R) of -0.542 and weighted average of 89.7%, a difference of 0.97%.
1 or more Vehicles in Household Correlation Summary
| Measurement | Uruguayan | Immigrants from Sudan |
| Minimum | 83.3% | 13.3% |
| Maximum | 100.0% | 100.0% |
| Range | 16.7% | 86.7% |
| Mean | 93.6% | 90.9% |
| Median | 93.3% | 92.4% |
| Interquartile 25% (IQ1) | 90.4% | 89.7% |
| Interquartile 75% (IQ3) | 98.2% | 95.0% |
| Interquartile Range (IQR) | 7.7% | 5.3% |
| Standard Deviation (Sample) | 4.8% | 11.7% |
| Standard Deviation (Population) | 4.7% | 11.6% |
Similar Demographics by 1 or more Vehicles in Household
Demographics Similar to Uruguayans by 1 or more Vehicles in Household
In terms of 1 or more vehicles in household, the demographic groups most similar to Uruguayans are Immigrants from South America (88.8%, a difference of 0.0%), Peruvian (88.8%, a difference of 0.050%), Immigrants from Hong Kong (88.7%, a difference of 0.050%), Cree (88.7%, a difference of 0.060%), and Immigrants from Zaire (88.8%, a difference of 0.070%).
| Demographics | Rating | Rank | 1 or more Vehicles in Household |
| Immigrants | Sri Lanka | 10.2 /100 | #215 | Poor 88.9% |
| Immigrants | Argentina | 9.4 /100 | #216 | Tragic 88.9% |
| Argentineans | 8.8 /100 | #217 | Tragic 88.9% |
| Ugandans | 8.7 /100 | #218 | Tragic 88.9% |
| Immigrants | Guatemala | 8.6 /100 | #219 | Tragic 88.9% |
| Immigrants | Zaire | 8.1 /100 | #220 | Tragic 88.8% |
| Peruvians | 7.9 /100 | #221 | Tragic 88.8% |
| Uruguayans | 7.0 /100 | #222 | Tragic 88.8% |
| Immigrants | South America | 7.0 /100 | #223 | Tragic 88.8% |
| Immigrants | Hong Kong | 6.2 /100 | #224 | Tragic 88.7% |
| Cree | 6.0 /100 | #225 | Tragic 88.7% |
| Cheyenne | 5.7 /100 | #226 | Tragic 88.7% |
| Ute | 5.6 /100 | #227 | Tragic 88.7% |
| Immigrants | Norway | 5.5 /100 | #228 | Tragic 88.7% |
| Immigrants | Romania | 5.4 /100 | #229 | Tragic 88.7% |
Demographics Similar to Immigrants from Sudan by 1 or more Vehicles in Household
In terms of 1 or more vehicles in household, the demographic groups most similar to Immigrants from Sudan are Immigrants from Burma/Myanmar (89.7%, a difference of 0.010%), Hmong (89.6%, a difference of 0.020%), Filipino (89.7%, a difference of 0.050%), Immigrants from El Salvador (89.6%, a difference of 0.050%), and German Russian (89.6%, a difference of 0.050%).
| Demographics | Rating | Rank | 1 or more Vehicles in Household |
| Natives/Alaskans | 59.5 /100 | #169 | Average 89.8% |
| Immigrants | Costa Rica | 57.6 /100 | #170 | Average 89.8% |
| French American Indians | 54.4 /100 | #171 | Average 89.8% |
| Indonesians | 53.0 /100 | #172 | Average 89.7% |
| Lumbee | 52.8 /100 | #173 | Average 89.7% |
| Filipinos | 50.0 /100 | #174 | Average 89.7% |
| Immigrants | Burma/Myanmar | 47.6 /100 | #175 | Average 89.7% |
| Immigrants | Sudan | 47.1 /100 | #176 | Average 89.7% |
| Hmong | 45.8 /100 | #177 | Average 89.6% |
| Immigrants | El Salvador | 44.1 /100 | #178 | Average 89.6% |
| German Russians | 44.0 /100 | #179 | Average 89.6% |
| Arabs | 43.3 /100 | #180 | Average 89.6% |
| Immigrants | Ethiopia | 42.5 /100 | #181 | Average 89.6% |
| Ukrainians | 42.4 /100 | #182 | Average 89.6% |
| Ethiopians | 41.2 /100 | #183 | Average 89.6% |