Uruguayan vs Ukrainian Single Female Poverty
COMPARE
Uruguayan
Ukrainian
Single Female Poverty
Single Female Poverty Comparison
Uruguayans
Ukrainians
20.2%
SINGLE FEMALE POVERTY
92.1/ 100
METRIC RATING
132nd/ 347
METRIC RANK
19.8%
SINGLE FEMALE POVERTY
97.6/ 100
METRIC RATING
100th/ 347
METRIC RANK
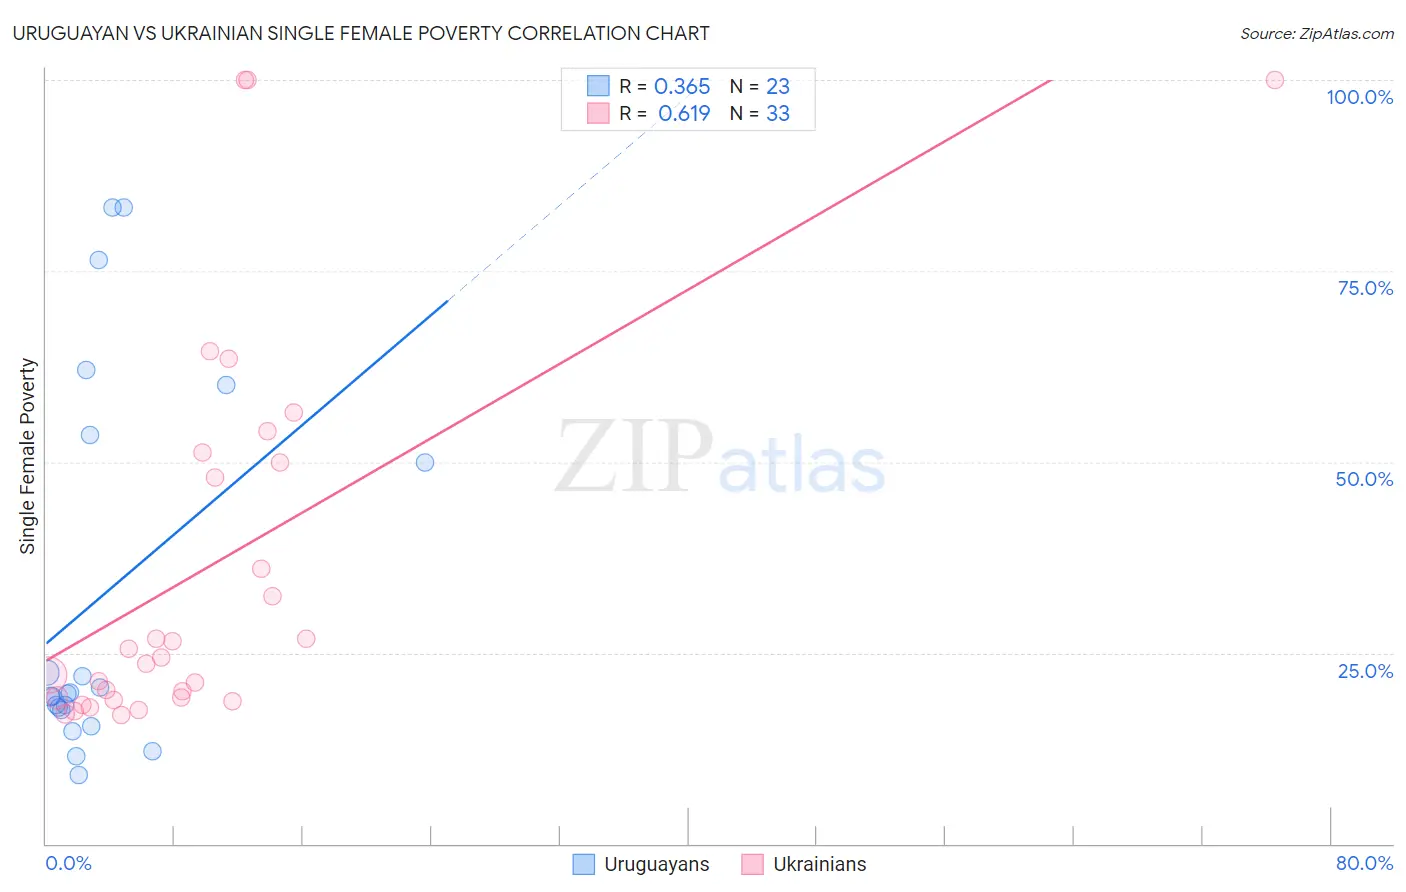
Uruguayan vs Ukrainian Single Female Poverty Correlation Chart
The statistical analysis conducted on geographies consisting of 143,837,387 people shows a mild positive correlation between the proportion of Uruguayans and poverty level among single females in the United States with a correlation coefficient (R) of 0.365 and weighted average of 20.2%. Similarly, the statistical analysis conducted on geographies consisting of 437,822,135 people shows a significant positive correlation between the proportion of Ukrainians and poverty level among single females in the United States with a correlation coefficient (R) of 0.619 and weighted average of 19.8%, a difference of 2.1%.
Single Female Poverty Correlation Summary
| Measurement | Uruguayan | Ukrainian |
| Minimum | 9.0% | 16.8% |
| Maximum | 83.3% | 100.0% |
| Range | 74.3% | 83.2% |
| Mean | 32.4% | 36.2% |
| Median | 19.7% | 24.4% |
| Interquartile 25% (IQ1) | 17.5% | 19.0% |
| Interquartile 75% (IQ3) | 53.6% | 50.6% |
| Interquartile Range (IQR) | 36.1% | 31.6% |
| Standard Deviation (Sample) | 24.7% | 25.1% |
| Standard Deviation (Population) | 24.1% | 24.8% |
Similar Demographics by Single Female Poverty
Demographics Similar to Uruguayans by Single Female Poverty
In terms of single female poverty, the demographic groups most similar to Uruguayans are Pakistani (20.2%, a difference of 0.0%), Immigrants from England (20.2%, a difference of 0.030%), Immigrants from Hungary (20.2%, a difference of 0.050%), Immigrants from Morocco (20.2%, a difference of 0.080%), and Immigrants from Venezuela (20.2%, a difference of 0.12%).
| Demographics | Rating | Rank | Single Female Poverty |
| Immigrants | South Africa | 93.9 /100 | #125 | Exceptional 20.1% |
| Serbians | 93.3 /100 | #126 | Exceptional 20.1% |
| Mongolians | 93.2 /100 | #127 | Exceptional 20.2% |
| Immigrants | Spain | 92.7 /100 | #128 | Exceptional 20.2% |
| Immigrants | Morocco | 92.4 /100 | #129 | Exceptional 20.2% |
| Immigrants | Hungary | 92.3 /100 | #130 | Exceptional 20.2% |
| Pakistanis | 92.1 /100 | #131 | Exceptional 20.2% |
| Uruguayans | 92.1 /100 | #132 | Exceptional 20.2% |
| Immigrants | England | 91.9 /100 | #133 | Exceptional 20.2% |
| Immigrants | Venezuela | 91.5 /100 | #134 | Exceptional 20.2% |
| Immigrants | Iraq | 91.2 /100 | #135 | Exceptional 20.2% |
| Immigrants | Canada | 91.2 /100 | #136 | Exceptional 20.2% |
| Immigrants | Nepal | 90.6 /100 | #137 | Exceptional 20.3% |
| Slovenes | 90.5 /100 | #138 | Exceptional 20.3% |
| Immigrants | Kuwait | 90.4 /100 | #139 | Exceptional 20.3% |
Demographics Similar to Ukrainians by Single Female Poverty
In terms of single female poverty, the demographic groups most similar to Ukrainians are Immigrants from Belgium (19.8%, a difference of 0.18%), Immigrants from Cameroon (19.8%, a difference of 0.19%), Sierra Leonean (19.7%, a difference of 0.25%), Immigrants from France (19.7%, a difference of 0.26%), and Immigrants from Southern Europe (19.9%, a difference of 0.31%).
| Demographics | Rating | Rank | Single Female Poverty |
| Immigrants | Austria | 98.8 /100 | #93 | Exceptional 19.6% |
| Romanians | 98.6 /100 | #94 | Exceptional 19.6% |
| Estonians | 98.2 /100 | #95 | Exceptional 19.7% |
| Immigrants | Brazil | 98.2 /100 | #96 | Exceptional 19.7% |
| Croatians | 98.1 /100 | #97 | Exceptional 19.7% |
| Immigrants | France | 97.9 /100 | #98 | Exceptional 19.7% |
| Sierra Leoneans | 97.9 /100 | #99 | Exceptional 19.7% |
| Ukrainians | 97.6 /100 | #100 | Exceptional 19.8% |
| Immigrants | Belgium | 97.3 /100 | #101 | Exceptional 19.8% |
| Immigrants | Cameroon | 97.3 /100 | #102 | Exceptional 19.8% |
| Immigrants | Southern Europe | 97.1 /100 | #103 | Exceptional 19.9% |
| Chileans | 96.9 /100 | #104 | Exceptional 19.9% |
| Israelis | 96.9 /100 | #105 | Exceptional 19.9% |
| Ethiopians | 96.7 /100 | #106 | Exceptional 19.9% |
| Immigrants | Syria | 96.7 /100 | #107 | Exceptional 19.9% |