Uruguayan vs Immigrants from Caribbean Single Female Poverty
COMPARE
Uruguayan
Immigrants from Caribbean
Single Female Poverty
Single Female Poverty Comparison
Uruguayans
Immigrants from Caribbean
20.2%
SINGLE FEMALE POVERTY
92.1/ 100
METRIC RATING
132nd/ 347
METRIC RANK
22.4%
SINGLE FEMALE POVERTY
1.3/ 100
METRIC RATING
249th/ 347
METRIC RANK
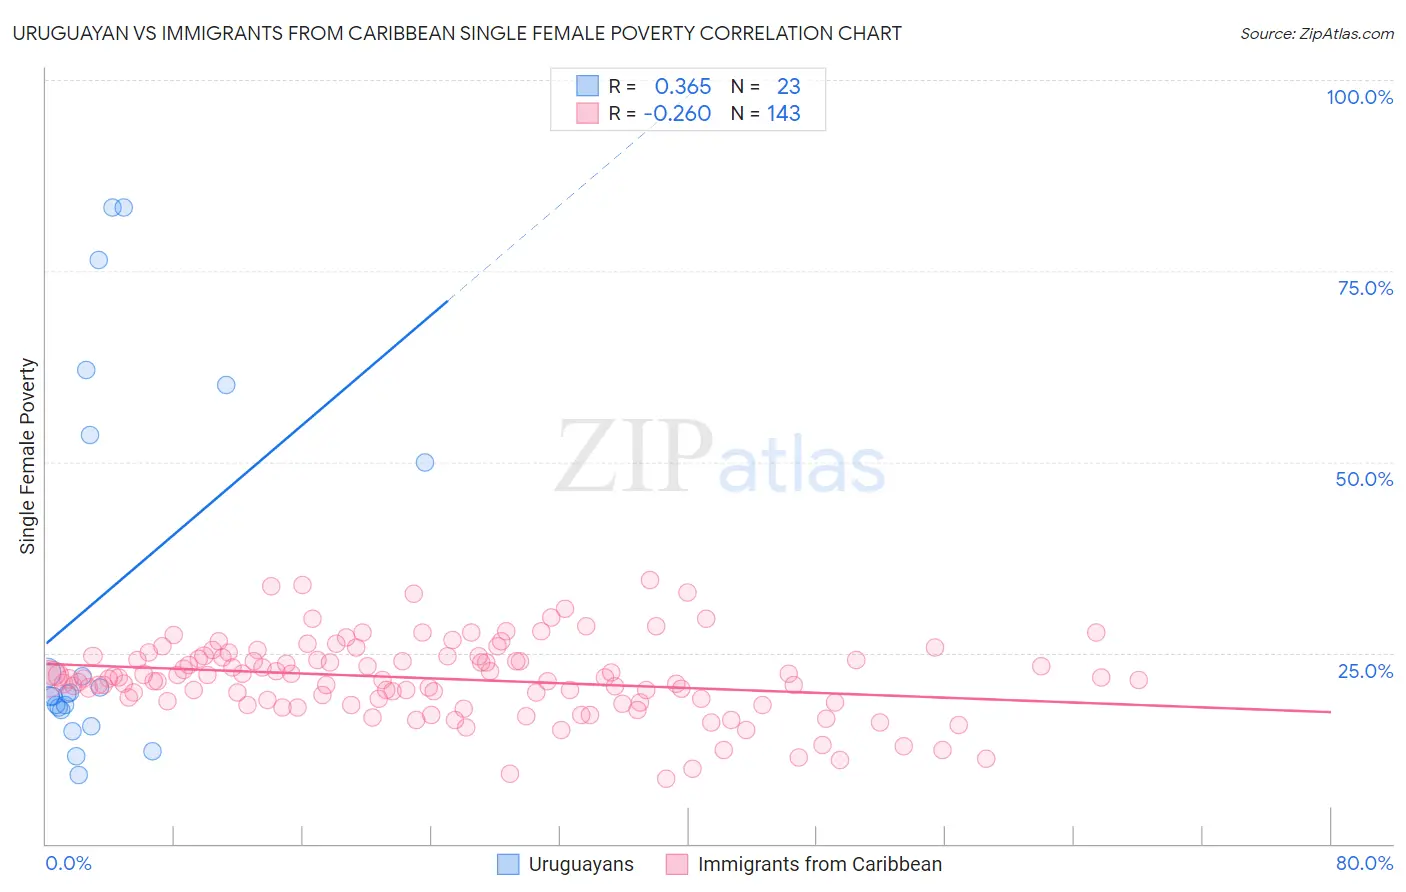
Uruguayan vs Immigrants from Caribbean Single Female Poverty Correlation Chart
The statistical analysis conducted on geographies consisting of 143,837,387 people shows a mild positive correlation between the proportion of Uruguayans and poverty level among single females in the United States with a correlation coefficient (R) of 0.365 and weighted average of 20.2%. Similarly, the statistical analysis conducted on geographies consisting of 441,756,238 people shows a weak negative correlation between the proportion of Immigrants from Caribbean and poverty level among single females in the United States with a correlation coefficient (R) of -0.260 and weighted average of 22.4%, a difference of 11.0%.
Single Female Poverty Correlation Summary
| Measurement | Uruguayan | Immigrants from Caribbean |
| Minimum | 9.0% | 8.5% |
| Maximum | 83.3% | 34.5% |
| Range | 74.3% | 25.9% |
| Mean | 32.4% | 21.6% |
| Median | 19.7% | 21.7% |
| Interquartile 25% (IQ1) | 17.5% | 18.7% |
| Interquartile 75% (IQ3) | 53.6% | 24.6% |
| Interquartile Range (IQR) | 36.1% | 5.9% |
| Standard Deviation (Sample) | 24.7% | 5.0% |
| Standard Deviation (Population) | 24.1% | 5.0% |
Similar Demographics by Single Female Poverty
Demographics Similar to Uruguayans by Single Female Poverty
In terms of single female poverty, the demographic groups most similar to Uruguayans are Pakistani (20.2%, a difference of 0.0%), Immigrants from England (20.2%, a difference of 0.030%), Immigrants from Hungary (20.2%, a difference of 0.050%), Immigrants from Morocco (20.2%, a difference of 0.080%), and Immigrants from Venezuela (20.2%, a difference of 0.12%).
| Demographics | Rating | Rank | Single Female Poverty |
| Immigrants | South Africa | 93.9 /100 | #125 | Exceptional 20.1% |
| Serbians | 93.3 /100 | #126 | Exceptional 20.1% |
| Mongolians | 93.2 /100 | #127 | Exceptional 20.2% |
| Immigrants | Spain | 92.7 /100 | #128 | Exceptional 20.2% |
| Immigrants | Morocco | 92.4 /100 | #129 | Exceptional 20.2% |
| Immigrants | Hungary | 92.3 /100 | #130 | Exceptional 20.2% |
| Pakistanis | 92.1 /100 | #131 | Exceptional 20.2% |
| Uruguayans | 92.1 /100 | #132 | Exceptional 20.2% |
| Immigrants | England | 91.9 /100 | #133 | Exceptional 20.2% |
| Immigrants | Venezuela | 91.5 /100 | #134 | Exceptional 20.2% |
| Immigrants | Iraq | 91.2 /100 | #135 | Exceptional 20.2% |
| Immigrants | Canada | 91.2 /100 | #136 | Exceptional 20.2% |
| Immigrants | Nepal | 90.6 /100 | #137 | Exceptional 20.3% |
| Slovenes | 90.5 /100 | #138 | Exceptional 20.3% |
| Immigrants | Kuwait | 90.4 /100 | #139 | Exceptional 20.3% |
Demographics Similar to Immigrants from Caribbean by Single Female Poverty
In terms of single female poverty, the demographic groups most similar to Immigrants from Caribbean are Belizean (22.4%, a difference of 0.10%), Immigrants from El Salvador (22.4%, a difference of 0.11%), Immigrants from Bahamas (22.5%, a difference of 0.15%), Liberian (22.4%, a difference of 0.17%), and Immigrants from West Indies (22.5%, a difference of 0.29%).
| Demographics | Rating | Rank | Single Female Poverty |
| Bermudans | 2.0 /100 | #242 | Tragic 22.3% |
| West Indians | 1.9 /100 | #243 | Tragic 22.3% |
| Immigrants | Middle Africa | 1.9 /100 | #244 | Tragic 22.3% |
| Immigrants | Bangladesh | 1.8 /100 | #245 | Tragic 22.3% |
| Liberians | 1.4 /100 | #246 | Tragic 22.4% |
| Immigrants | El Salvador | 1.4 /100 | #247 | Tragic 22.4% |
| Belizeans | 1.4 /100 | #248 | Tragic 22.4% |
| Immigrants | Caribbean | 1.3 /100 | #249 | Tragic 22.4% |
| Immigrants | Bahamas | 1.2 /100 | #250 | Tragic 22.5% |
| Immigrants | West Indies | 1.0 /100 | #251 | Tragic 22.5% |
| Delaware | 1.0 /100 | #252 | Tragic 22.5% |
| Immigrants | Liberia | 0.9 /100 | #253 | Tragic 22.5% |
| Immigrants | Burma/Myanmar | 0.8 /100 | #254 | Tragic 22.6% |
| Immigrants | Sudan | 0.8 /100 | #255 | Tragic 22.6% |
| Immigrants | Belize | 0.8 /100 | #256 | Tragic 22.6% |