Turkish vs Czechoslovakian Child Poverty Among Boys Under 16
COMPARE
Turkish
Czechoslovakian
Child Poverty Among Boys Under 16
Child Poverty Among Boys Under 16 Comparison
Turks
Czechoslovakians
13.6%
CHILD POVERTY AMONG BOYS UNDER 16
99.8/ 100
METRIC RATING
31st/ 347
METRIC RANK
15.3%
CHILD POVERTY AMONG BOYS UNDER 16
92.1/ 100
METRIC RATING
125th/ 347
METRIC RANK
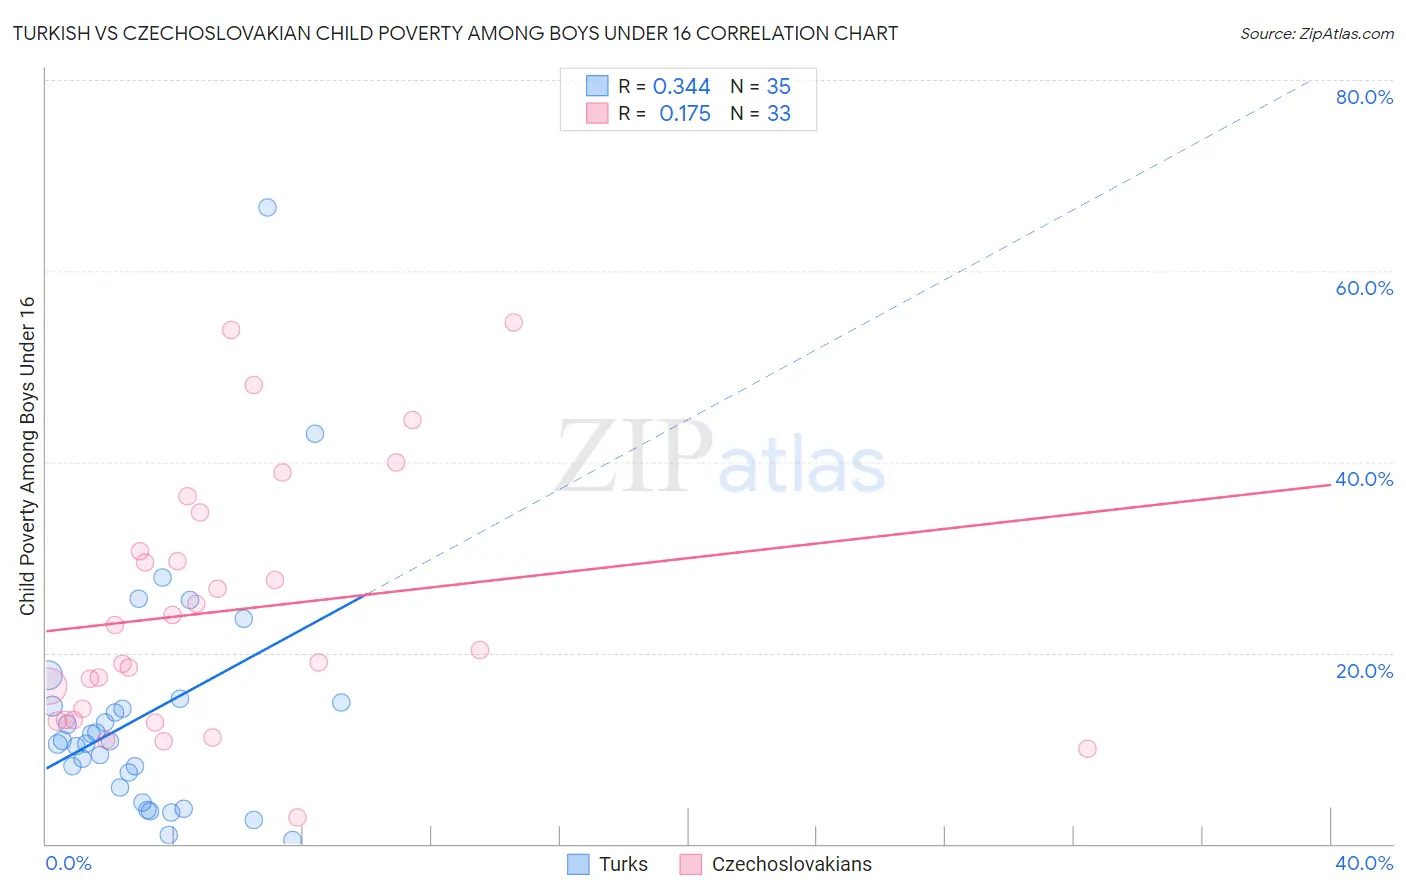
Turkish vs Czechoslovakian Child Poverty Among Boys Under 16 Correlation Chart
The statistical analysis conducted on geographies consisting of 268,078,703 people shows a mild positive correlation between the proportion of Turks and poverty level among boys under the age of 16 in the United States with a correlation coefficient (R) of 0.344 and weighted average of 13.6%. Similarly, the statistical analysis conducted on geographies consisting of 361,979,827 people shows a poor positive correlation between the proportion of Czechoslovakians and poverty level among boys under the age of 16 in the United States with a correlation coefficient (R) of 0.175 and weighted average of 15.3%, a difference of 12.7%.
Child Poverty Among Boys Under 16 Correlation Summary
| Measurement | Turkish | Czechoslovakian |
| Minimum | 0.40% | 2.7% |
| Maximum | 66.7% | 54.7% |
| Range | 66.3% | 51.9% |
| Mean | 13.5% | 24.4% |
| Median | 10.7% | 20.3% |
| Interquartile 25% (IQ1) | 5.9% | 13.0% |
| Interquartile 75% (IQ3) | 14.8% | 32.7% |
| Interquartile Range (IQR) | 8.9% | 19.7% |
| Standard Deviation (Sample) | 12.7% | 13.3% |
| Standard Deviation (Population) | 12.5% | 13.1% |
Similar Demographics by Child Poverty Among Boys Under 16
Demographics Similar to Turks by Child Poverty Among Boys Under 16
In terms of child poverty among boys under 16, the demographic groups most similar to Turks are Swedish (13.6%, a difference of 0.080%), Immigrants from China (13.6%, a difference of 0.090%), Cypriot (13.6%, a difference of 0.18%), Danish (13.6%, a difference of 0.27%), and Eastern European (13.5%, a difference of 0.37%).
| Demographics | Rating | Rank | Child Poverty Among Boys Under 16 |
| Immigrants | Lithuania | 99.8 /100 | #24 | Exceptional 13.5% |
| Okinawans | 99.8 /100 | #25 | Exceptional 13.5% |
| Immigrants | Bolivia | 99.8 /100 | #26 | Exceptional 13.5% |
| Asians | 99.8 /100 | #27 | Exceptional 13.5% |
| Eastern Europeans | 99.8 /100 | #28 | Exceptional 13.5% |
| Cypriots | 99.8 /100 | #29 | Exceptional 13.6% |
| Swedes | 99.8 /100 | #30 | Exceptional 13.6% |
| Turks | 99.8 /100 | #31 | Exceptional 13.6% |
| Immigrants | China | 99.8 /100 | #32 | Exceptional 13.6% |
| Danes | 99.8 /100 | #33 | Exceptional 13.6% |
| Assyrians/Chaldeans/Syriacs | 99.8 /100 | #34 | Exceptional 13.6% |
| Russians | 99.7 /100 | #35 | Exceptional 13.8% |
| Luxembourgers | 99.7 /100 | #36 | Exceptional 13.8% |
| Immigrants | Sri Lanka | 99.6 /100 | #37 | Exceptional 13.9% |
| Immigrants | Northern Europe | 99.6 /100 | #38 | Exceptional 13.9% |
Demographics Similar to Czechoslovakians by Child Poverty Among Boys Under 16
In terms of child poverty among boys under 16, the demographic groups most similar to Czechoslovakians are Tlingit-Haida (15.3%, a difference of 0.070%), Immigrants from Norway (15.3%, a difference of 0.080%), Immigrants from Malaysia (15.3%, a difference of 0.30%), Palestinian (15.4%, a difference of 0.31%), and Carpatho Rusyn (15.4%, a difference of 0.36%).
| Demographics | Rating | Rank | Child Poverty Among Boys Under 16 |
| Native Hawaiians | 93.4 /100 | #118 | Exceptional 15.2% |
| Belgians | 93.1 /100 | #119 | Exceptional 15.2% |
| South Africans | 93.0 /100 | #120 | Exceptional 15.2% |
| Scottish | 93.0 /100 | #121 | Exceptional 15.2% |
| Immigrants | Malaysia | 92.8 /100 | #122 | Exceptional 15.3% |
| Immigrants | Norway | 92.3 /100 | #123 | Exceptional 15.3% |
| Tlingit-Haida | 92.2 /100 | #124 | Exceptional 15.3% |
| Czechoslovakians | 92.1 /100 | #125 | Exceptional 15.3% |
| Palestinians | 91.3 /100 | #126 | Exceptional 15.4% |
| Carpatho Rusyns | 91.1 /100 | #127 | Exceptional 15.4% |
| Canadians | 90.6 /100 | #128 | Exceptional 15.4% |
| Immigrants | Brazil | 90.3 /100 | #129 | Exceptional 15.4% |
| Mongolians | 90.2 /100 | #130 | Exceptional 15.4% |
| Immigrants | Western Europe | 90.0 /100 | #131 | Exceptional 15.4% |
| Immigrants | Kazakhstan | 88.7 /100 | #132 | Excellent 15.5% |