Immigrants from Cuba vs Czechoslovakian Child Poverty Among Boys Under 16
COMPARE
Immigrants from Cuba
Czechoslovakian
Child Poverty Among Boys Under 16
Child Poverty Among Boys Under 16 Comparison
Immigrants from Cuba
Czechoslovakians
18.8%
CHILD POVERTY AMONG BOYS UNDER 16
0.6/ 100
METRIC RATING
240th/ 347
METRIC RANK
15.3%
CHILD POVERTY AMONG BOYS UNDER 16
92.1/ 100
METRIC RATING
125th/ 347
METRIC RANK
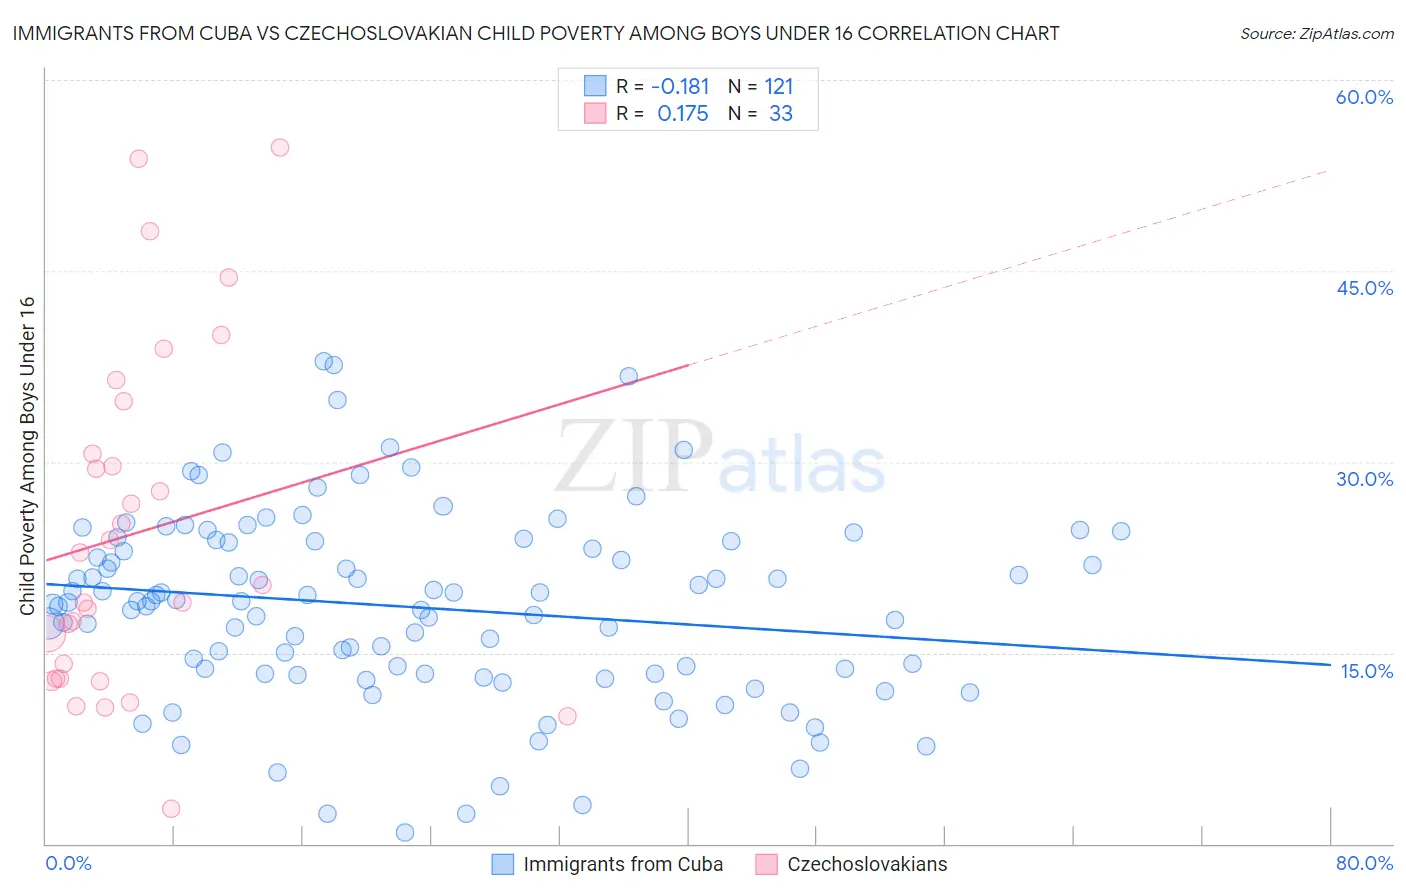
Immigrants from Cuba vs Czechoslovakian Child Poverty Among Boys Under 16 Correlation Chart
The statistical analysis conducted on geographies consisting of 321,856,633 people shows a poor negative correlation between the proportion of Immigrants from Cuba and poverty level among boys under the age of 16 in the United States with a correlation coefficient (R) of -0.181 and weighted average of 18.8%. Similarly, the statistical analysis conducted on geographies consisting of 361,979,827 people shows a poor positive correlation between the proportion of Czechoslovakians and poverty level among boys under the age of 16 in the United States with a correlation coefficient (R) of 0.175 and weighted average of 15.3%, a difference of 22.6%.
Child Poverty Among Boys Under 16 Correlation Summary
| Measurement | Immigrants from Cuba | Czechoslovakian |
| Minimum | 0.84% | 2.7% |
| Maximum | 37.9% | 54.7% |
| Range | 37.1% | 51.9% |
| Mean | 18.6% | 24.4% |
| Median | 19.0% | 20.3% |
| Interquartile 25% (IQ1) | 13.4% | 13.0% |
| Interquartile 75% (IQ3) | 23.8% | 32.7% |
| Interquartile Range (IQR) | 10.4% | 19.7% |
| Standard Deviation (Sample) | 7.4% | 13.3% |
| Standard Deviation (Population) | 7.4% | 13.1% |
Similar Demographics by Child Poverty Among Boys Under 16
Demographics Similar to Immigrants from Cuba by Child Poverty Among Boys Under 16
In terms of child poverty among boys under 16, the demographic groups most similar to Immigrants from Cuba are Immigrants from Sudan (18.8%, a difference of 0.050%), Cape Verdean (18.7%, a difference of 0.34%), Ghanaian (18.9%, a difference of 0.56%), Immigrants from Laos (18.7%, a difference of 0.57%), and Immigrants from Eritrea (18.6%, a difference of 0.79%).
| Demographics | Rating | Rank | Child Poverty Among Boys Under 16 |
| Immigrants | Nigeria | 1.2 /100 | #233 | Tragic 18.4% |
| Nigerians | 1.1 /100 | #234 | Tragic 18.5% |
| Americans | 0.9 /100 | #235 | Tragic 18.6% |
| Sudanese | 0.9 /100 | #236 | Tragic 18.6% |
| Immigrants | Eritrea | 0.8 /100 | #237 | Tragic 18.6% |
| Immigrants | Laos | 0.8 /100 | #238 | Tragic 18.7% |
| Cape Verdeans | 0.7 /100 | #239 | Tragic 18.7% |
| Immigrants | Cuba | 0.6 /100 | #240 | Tragic 18.8% |
| Immigrants | Sudan | 0.6 /100 | #241 | Tragic 18.8% |
| Ghanaians | 0.5 /100 | #242 | Tragic 18.9% |
| Immigrants | Azores | 0.4 /100 | #243 | Tragic 18.9% |
| Immigrants | Middle Africa | 0.4 /100 | #244 | Tragic 18.9% |
| Cree | 0.4 /100 | #245 | Tragic 19.0% |
| Immigrants | Nicaragua | 0.4 /100 | #246 | Tragic 19.0% |
| Immigrants | Trinidad and Tobago | 0.3 /100 | #247 | Tragic 19.0% |
Demographics Similar to Czechoslovakians by Child Poverty Among Boys Under 16
In terms of child poverty among boys under 16, the demographic groups most similar to Czechoslovakians are Tlingit-Haida (15.3%, a difference of 0.070%), Immigrants from Norway (15.3%, a difference of 0.080%), Immigrants from Malaysia (15.3%, a difference of 0.30%), Palestinian (15.4%, a difference of 0.31%), and Carpatho Rusyn (15.4%, a difference of 0.36%).
| Demographics | Rating | Rank | Child Poverty Among Boys Under 16 |
| Native Hawaiians | 93.4 /100 | #118 | Exceptional 15.2% |
| Belgians | 93.1 /100 | #119 | Exceptional 15.2% |
| South Africans | 93.0 /100 | #120 | Exceptional 15.2% |
| Scottish | 93.0 /100 | #121 | Exceptional 15.2% |
| Immigrants | Malaysia | 92.8 /100 | #122 | Exceptional 15.3% |
| Immigrants | Norway | 92.3 /100 | #123 | Exceptional 15.3% |
| Tlingit-Haida | 92.2 /100 | #124 | Exceptional 15.3% |
| Czechoslovakians | 92.1 /100 | #125 | Exceptional 15.3% |
| Palestinians | 91.3 /100 | #126 | Exceptional 15.4% |
| Carpatho Rusyns | 91.1 /100 | #127 | Exceptional 15.4% |
| Canadians | 90.6 /100 | #128 | Exceptional 15.4% |
| Immigrants | Brazil | 90.3 /100 | #129 | Exceptional 15.4% |
| Mongolians | 90.2 /100 | #130 | Exceptional 15.4% |
| Immigrants | Western Europe | 90.0 /100 | #131 | Exceptional 15.4% |
| Immigrants | Kazakhstan | 88.7 /100 | #132 | Excellent 15.5% |