Tsimshian vs Kenyan Married-Couple Family Poverty
COMPARE
Tsimshian
Kenyan
Married-Couple Family Poverty
Married-Couple Family Poverty Comparison
Tsimshian
Kenyans
5.9%
MARRIED-COUPLE FAMILY POVERTY
1.1/ 100
METRIC RATING
249th/ 347
METRIC RANK
4.8%
MARRIED-COUPLE FAMILY POVERTY
94.7/ 100
METRIC RATING
117th/ 347
METRIC RANK
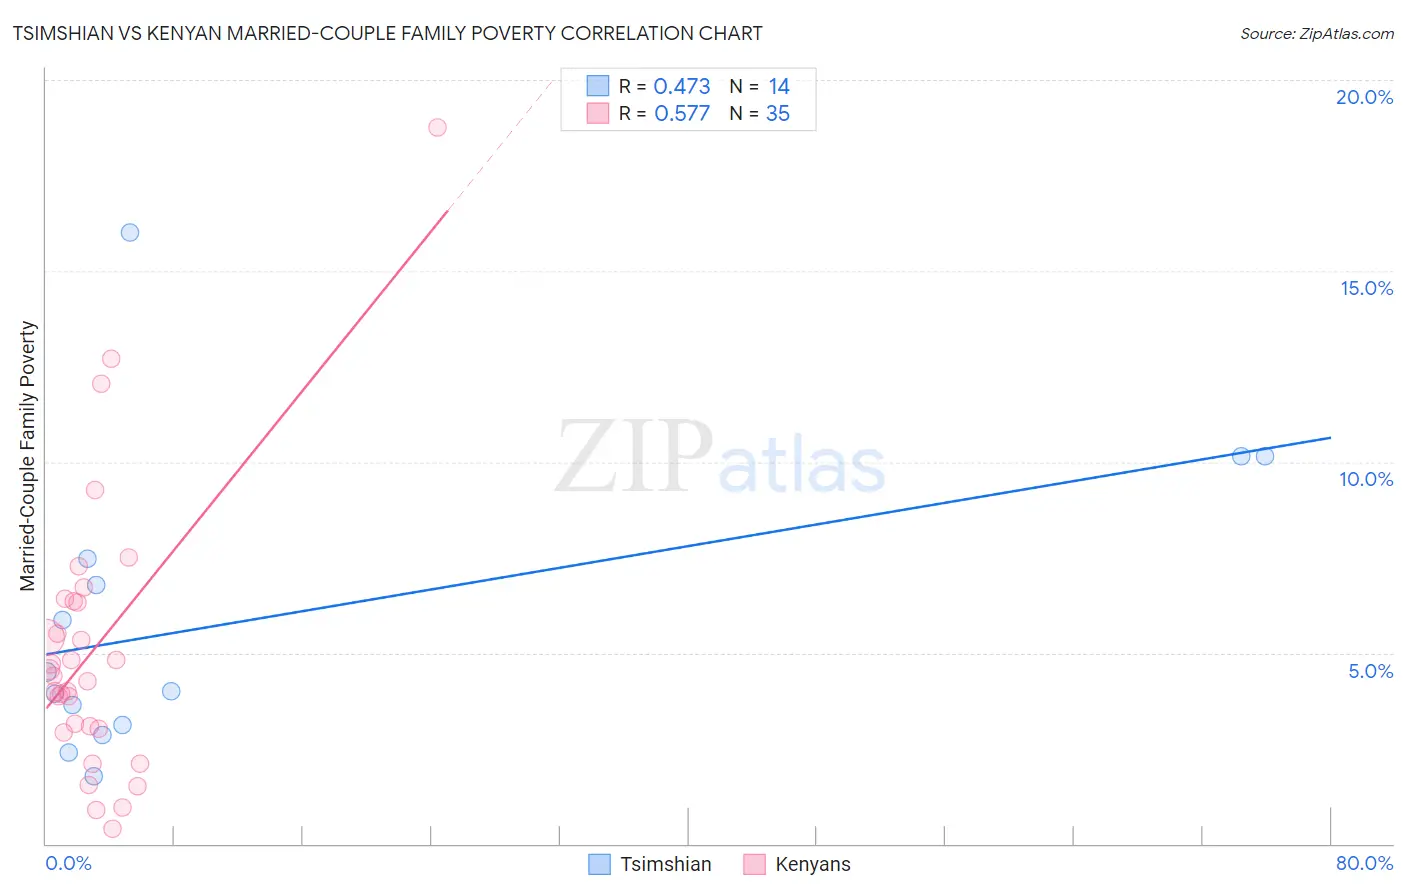
Tsimshian vs Kenyan Married-Couple Family Poverty Correlation Chart
The statistical analysis conducted on geographies consisting of 15,607,762 people shows a moderate positive correlation between the proportion of Tsimshian and poverty level among married-couple families in the United States with a correlation coefficient (R) of 0.473 and weighted average of 5.9%. Similarly, the statistical analysis conducted on geographies consisting of 167,574,201 people shows a substantial positive correlation between the proportion of Kenyans and poverty level among married-couple families in the United States with a correlation coefficient (R) of 0.577 and weighted average of 4.8%, a difference of 23.3%.
Married-Couple Family Poverty Correlation Summary
| Measurement | Tsimshian | Kenyan |
| Minimum | 1.8% | 0.40% |
| Maximum | 16.0% | 18.8% |
| Range | 14.2% | 18.3% |
| Mean | 5.9% | 5.1% |
| Median | 4.2% | 4.4% |
| Interquartile 25% (IQ1) | 3.1% | 3.0% |
| Interquartile 75% (IQ3) | 7.5% | 6.3% |
| Interquartile Range (IQR) | 4.4% | 3.3% |
| Standard Deviation (Sample) | 3.9% | 3.7% |
| Standard Deviation (Population) | 3.8% | 3.6% |
Similar Demographics by Married-Couple Family Poverty
Demographics Similar to Tsimshian by Married-Couple Family Poverty
In terms of married-couple family poverty, the demographic groups most similar to Tsimshian are Cree (5.9%, a difference of 0.10%), Immigrants from Eritrea (5.9%, a difference of 0.21%), Immigrants from Ghana (5.9%, a difference of 0.46%), Iraqi (5.9%, a difference of 0.52%), and Immigrants from Western Asia (6.0%, a difference of 1.1%).
| Demographics | Rating | Rank | Married-Couple Family Poverty |
| Immigrants | Western Africa | 2.4 /100 | #242 | Tragic 5.8% |
| Somalis | 2.3 /100 | #243 | Tragic 5.8% |
| Chickasaw | 2.3 /100 | #244 | Tragic 5.8% |
| Immigrants | Afghanistan | 2.1 /100 | #245 | Tragic 5.8% |
| Immigrants | Venezuela | 1.8 /100 | #246 | Tragic 5.8% |
| Iraqis | 1.4 /100 | #247 | Tragic 5.9% |
| Cree | 1.2 /100 | #248 | Tragic 5.9% |
| Tsimshian | 1.1 /100 | #249 | Tragic 5.9% |
| Immigrants | Eritrea | 1.1 /100 | #250 | Tragic 5.9% |
| Immigrants | Ghana | 1.0 /100 | #251 | Tragic 5.9% |
| Immigrants | Western Asia | 0.7 /100 | #252 | Tragic 6.0% |
| Africans | 0.7 /100 | #253 | Tragic 6.0% |
| Immigrants | Somalia | 0.7 /100 | #254 | Tragic 6.0% |
| Comanche | 0.7 /100 | #255 | Tragic 6.0% |
| Bangladeshis | 0.5 /100 | #256 | Tragic 6.0% |
Demographics Similar to Kenyans by Married-Couple Family Poverty
In terms of married-couple family poverty, the demographic groups most similar to Kenyans are Immigrants from Philippines (4.8%, a difference of 0.020%), Celtic (4.8%, a difference of 0.10%), Taiwanese (4.8%, a difference of 0.11%), Immigrants from Indonesia (4.8%, a difference of 0.26%), and Immigrants from Eastern Asia (4.8%, a difference of 0.39%).
| Demographics | Rating | Rank | Married-Couple Family Poverty |
| Immigrants | Bolivia | 96.2 /100 | #110 | Exceptional 4.7% |
| Pakistanis | 96.2 /100 | #111 | Exceptional 4.7% |
| Tongans | 95.9 /100 | #112 | Exceptional 4.7% |
| Immigrants | Nepal | 95.9 /100 | #113 | Exceptional 4.7% |
| Immigrants | Indonesia | 95.1 /100 | #114 | Exceptional 4.8% |
| Taiwanese | 94.8 /100 | #115 | Exceptional 4.8% |
| Celtics | 94.8 /100 | #116 | Exceptional 4.8% |
| Kenyans | 94.7 /100 | #117 | Exceptional 4.8% |
| Immigrants | Philippines | 94.6 /100 | #118 | Exceptional 4.8% |
| Immigrants | Eastern Asia | 94.0 /100 | #119 | Exceptional 4.8% |
| Immigrants | Southern Europe | 93.4 /100 | #120 | Exceptional 4.8% |
| Indians (Asian) | 93.2 /100 | #121 | Exceptional 4.8% |
| Whites/Caucasians | 93.1 /100 | #122 | Exceptional 4.8% |
| Jordanians | 93.1 /100 | #123 | Exceptional 4.8% |
| Romanians | 92.5 /100 | #124 | Exceptional 4.8% |