Tongan vs Subsaharan African 7th Grade
COMPARE
Tongan
Subsaharan African
7th Grade
7th Grade Comparison
Tongans
Sub-Saharan Africans
95.4%
7TH GRADE
1.3/ 100
METRIC RATING
247th/ 347
METRIC RANK
95.7%
7TH GRADE
7.2/ 100
METRIC RATING
220th/ 347
METRIC RANK
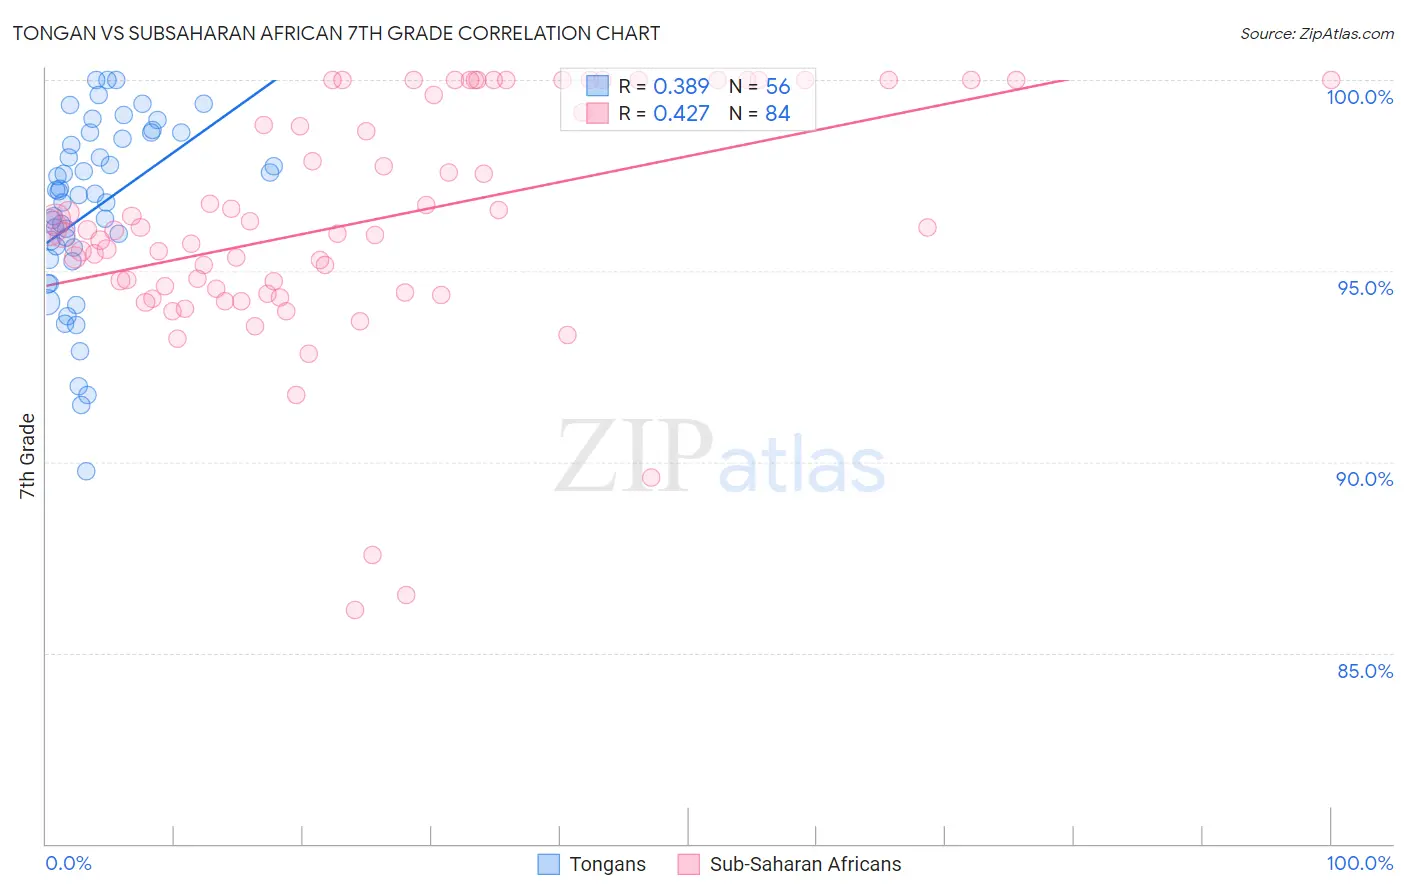
Tongan vs Subsaharan African 7th Grade Correlation Chart
The statistical analysis conducted on geographies consisting of 102,873,790 people shows a mild positive correlation between the proportion of Tongans and percentage of population with at least 7th grade education in the United States with a correlation coefficient (R) of 0.389 and weighted average of 95.4%. Similarly, the statistical analysis conducted on geographies consisting of 508,210,020 people shows a moderate positive correlation between the proportion of Sub-Saharan Africans and percentage of population with at least 7th grade education in the United States with a correlation coefficient (R) of 0.427 and weighted average of 95.7%, a difference of 0.27%.
7th Grade Correlation Summary
| Measurement | Tongan | Subsaharan African |
| Minimum | 89.7% | 86.1% |
| Maximum | 100.0% | 100.0% |
| Range | 10.3% | 13.9% |
| Mean | 96.6% | 96.3% |
| Median | 97.0% | 96.1% |
| Interquartile 25% (IQ1) | 95.5% | 94.5% |
| Interquartile 75% (IQ3) | 98.5% | 99.8% |
| Interquartile Range (IQR) | 3.1% | 5.3% |
| Standard Deviation (Sample) | 2.3% | 3.1% |
| Standard Deviation (Population) | 2.3% | 3.1% |
Similar Demographics by 7th Grade
Demographics Similar to Tongans by 7th Grade
In terms of 7th grade, the demographic groups most similar to Tongans are Ethiopian (95.4%, a difference of 0.020%), Paiute (95.4%, a difference of 0.020%), Uruguayan (95.4%, a difference of 0.030%), Immigrants from Middle Africa (95.4%, a difference of 0.030%), and Bolivian (95.4%, a difference of 0.030%).
| Demographics | Rating | Rank | 7th Grade |
| Immigrants | Sierra Leone | 2.0 /100 | #240 | Tragic 95.5% |
| South American Indians | 2.0 /100 | #241 | Tragic 95.5% |
| Immigrants | Senegal | 1.9 /100 | #242 | Tragic 95.5% |
| U.S. Virgin Islanders | 1.6 /100 | #243 | Tragic 95.4% |
| Uruguayans | 1.6 /100 | #244 | Tragic 95.4% |
| Immigrants | Middle Africa | 1.5 /100 | #245 | Tragic 95.4% |
| Ethiopians | 1.5 /100 | #246 | Tragic 95.4% |
| Tongans | 1.3 /100 | #247 | Tragic 95.4% |
| Paiute | 1.2 /100 | #248 | Tragic 95.4% |
| Bolivians | 1.1 /100 | #249 | Tragic 95.4% |
| Immigrants | Cameroon | 0.9 /100 | #250 | Tragic 95.4% |
| Immigrants | Jamaica | 0.9 /100 | #251 | Tragic 95.4% |
| Immigrants | Ethiopia | 0.9 /100 | #252 | Tragic 95.3% |
| Somalis | 0.9 /100 | #253 | Tragic 95.3% |
| Colombians | 0.8 /100 | #254 | Tragic 95.3% |
Demographics Similar to Sub-Saharan Africans by 7th Grade
In terms of 7th grade, the demographic groups most similar to Sub-Saharan Africans are Samoan (95.7%, a difference of 0.0%), Laotian (95.7%, a difference of 0.010%), Immigrants from Syria (95.7%, a difference of 0.010%), Immigrants from Oceania (95.7%, a difference of 0.010%), and Immigrants from Liberia (95.7%, a difference of 0.020%).
| Demographics | Rating | Rank | 7th Grade |
| Immigrants | Morocco | 12.6 /100 | #213 | Poor 95.8% |
| Bahamians | 11.6 /100 | #214 | Poor 95.7% |
| Spanish Americans | 9.3 /100 | #215 | Tragic 95.7% |
| Immigrants | Chile | 9.1 /100 | #216 | Tragic 95.7% |
| Immigrants | Pakistan | 9.0 /100 | #217 | Tragic 95.7% |
| Immigrants | Liberia | 8.1 /100 | #218 | Tragic 95.7% |
| Immigrants | Southern Europe | 7.9 /100 | #219 | Tragic 95.7% |
| Sub-Saharan Africans | 7.2 /100 | #220 | Tragic 95.7% |
| Samoans | 7.0 /100 | #221 | Tragic 95.7% |
| Laotians | 6.8 /100 | #222 | Tragic 95.7% |
| Immigrants | Syria | 6.7 /100 | #223 | Tragic 95.7% |
| Immigrants | Oceania | 6.7 /100 | #224 | Tragic 95.7% |
| Immigrants | Malaysia | 6.2 /100 | #225 | Tragic 95.6% |
| Immigrants | Eastern Asia | 5.8 /100 | #226 | Tragic 95.6% |
| Immigrants | Western Asia | 5.4 /100 | #227 | Tragic 95.6% |