Tongan vs Immigrants from Scotland Poverty
COMPARE
Tongan
Immigrants from Scotland
Poverty
Poverty Comparison
Tongans
Immigrants from Scotland
10.8%
POVERTY
99.4/ 100
METRIC RATING
35th/ 347
METRIC RANK
10.6%
POVERTY
99.7/ 100
METRIC RATING
19th/ 347
METRIC RANK
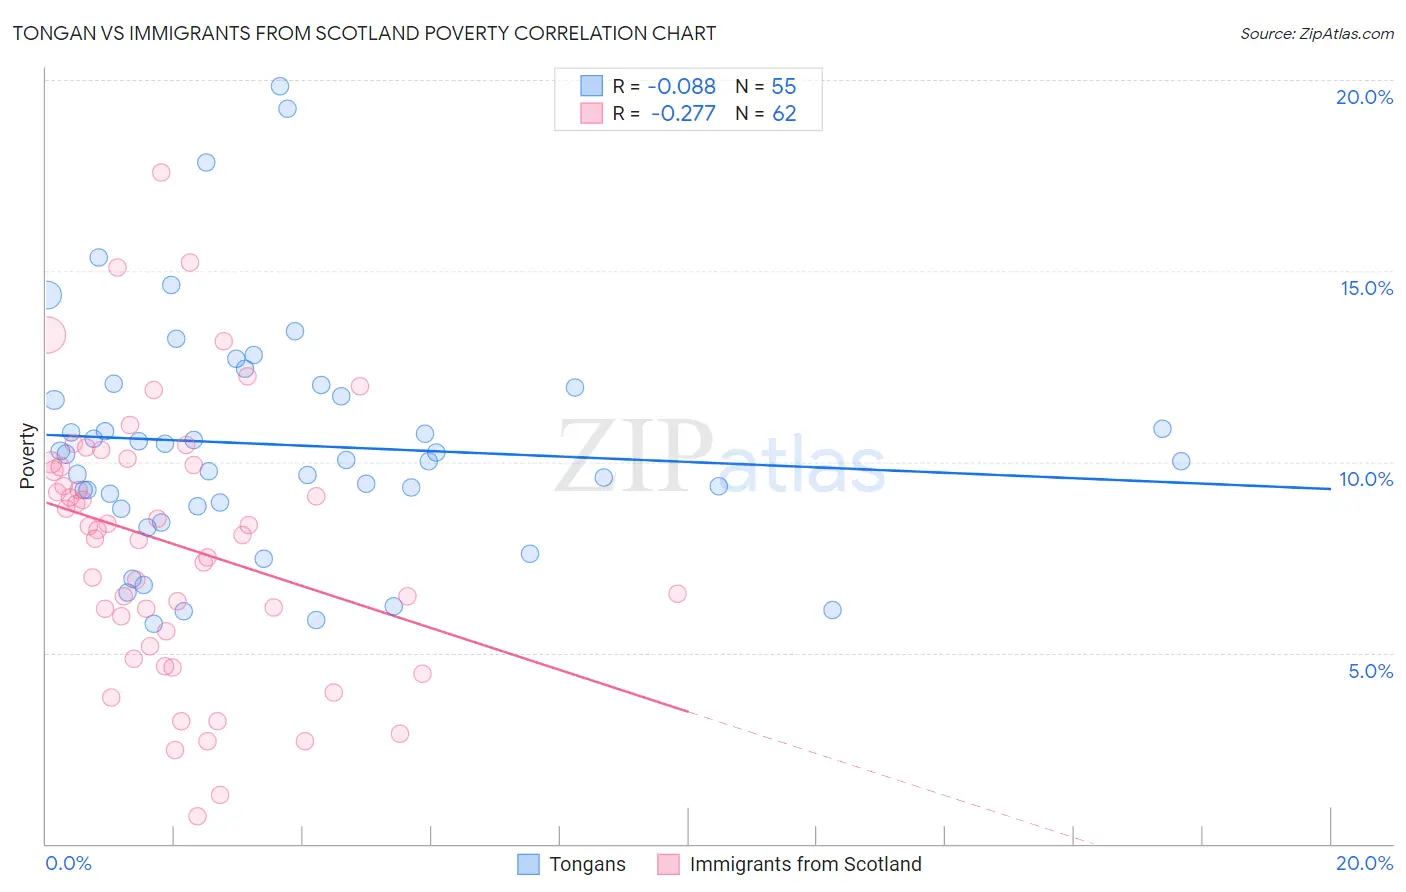
Tongan vs Immigrants from Scotland Poverty Correlation Chart
The statistical analysis conducted on geographies consisting of 102,864,002 people shows a slight negative correlation between the proportion of Tongans and poverty level in the United States with a correlation coefficient (R) of -0.088 and weighted average of 10.8%. Similarly, the statistical analysis conducted on geographies consisting of 196,384,756 people shows a weak negative correlation between the proportion of Immigrants from Scotland and poverty level in the United States with a correlation coefficient (R) of -0.277 and weighted average of 10.6%, a difference of 2.4%.
Poverty Correlation Summary
| Measurement | Tongan | Immigrants from Scotland |
| Minimum | 5.8% | 0.74% |
| Maximum | 19.8% | 17.6% |
| Range | 14.1% | 16.8% |
| Mean | 10.4% | 7.8% |
| Median | 10.1% | 8.2% |
| Interquartile 25% (IQ1) | 8.8% | 5.6% |
| Interquartile 75% (IQ3) | 12.0% | 9.9% |
| Interquartile Range (IQR) | 3.1% | 4.4% |
| Standard Deviation (Sample) | 3.1% | 3.5% |
| Standard Deviation (Population) | 3.0% | 3.4% |
Demographics Similar to Tongans and Immigrants from Scotland by Poverty
In terms of poverty, the demographic groups most similar to Tongans are Immigrants from Poland (10.8%, a difference of 0.040%), Cypriot (10.8%, a difference of 0.080%), Macedonian (10.8%, a difference of 0.14%), Immigrants from Greece (10.8%, a difference of 0.17%), and Iranian (10.7%, a difference of 0.68%). Similarly, the demographic groups most similar to Immigrants from Scotland are Immigrants from North Macedonia (10.6%, a difference of 0.11%), Luxembourger (10.6%, a difference of 0.19%), Eastern European (10.6%, a difference of 0.35%), Latvian (10.5%, a difference of 0.39%), and Swedish (10.6%, a difference of 0.46%).
| Demographics | Rating | Rank | Poverty |
| Norwegians | 99.8 /100 | #17 | Exceptional 10.5% |
| Latvians | 99.8 /100 | #18 | Exceptional 10.5% |
| Immigrants | Scotland | 99.7 /100 | #19 | Exceptional 10.6% |
| Immigrants | North Macedonia | 99.7 /100 | #20 | Exceptional 10.6% |
| Luxembourgers | 99.7 /100 | #21 | Exceptional 10.6% |
| Eastern Europeans | 99.7 /100 | #22 | Exceptional 10.6% |
| Swedes | 99.7 /100 | #23 | Exceptional 10.6% |
| Italians | 99.7 /100 | #24 | Exceptional 10.6% |
| Croatians | 99.6 /100 | #25 | Exceptional 10.6% |
| Burmese | 99.6 /100 | #26 | Exceptional 10.7% |
| Immigrants | Northern Europe | 99.6 /100 | #27 | Exceptional 10.7% |
| Immigrants | Korea | 99.5 /100 | #28 | Exceptional 10.7% |
| Greeks | 99.5 /100 | #29 | Exceptional 10.7% |
| Danes | 99.5 /100 | #30 | Exceptional 10.7% |
| Poles | 99.5 /100 | #31 | Exceptional 10.7% |
| Iranians | 99.5 /100 | #32 | Exceptional 10.7% |
| Macedonians | 99.4 /100 | #33 | Exceptional 10.8% |
| Immigrants | Poland | 99.4 /100 | #34 | Exceptional 10.8% |
| Tongans | 99.4 /100 | #35 | Exceptional 10.8% |
| Cypriots | 99.3 /100 | #36 | Exceptional 10.8% |
| Immigrants | Greece | 99.3 /100 | #37 | Exceptional 10.8% |