Tongan vs Subsaharan African Associate's Degree
COMPARE
Tongan
Subsaharan African
Associate's Degree
Associate's Degree Comparison
Tongans
Sub-Saharan Africans
43.0%
ASSOCIATE'S DEGREE
2.2/ 100
METRIC RATING
233rd/ 347
METRIC RANK
43.9%
ASSOCIATE'S DEGREE
5.5/ 100
METRIC RATING
223rd/ 347
METRIC RANK
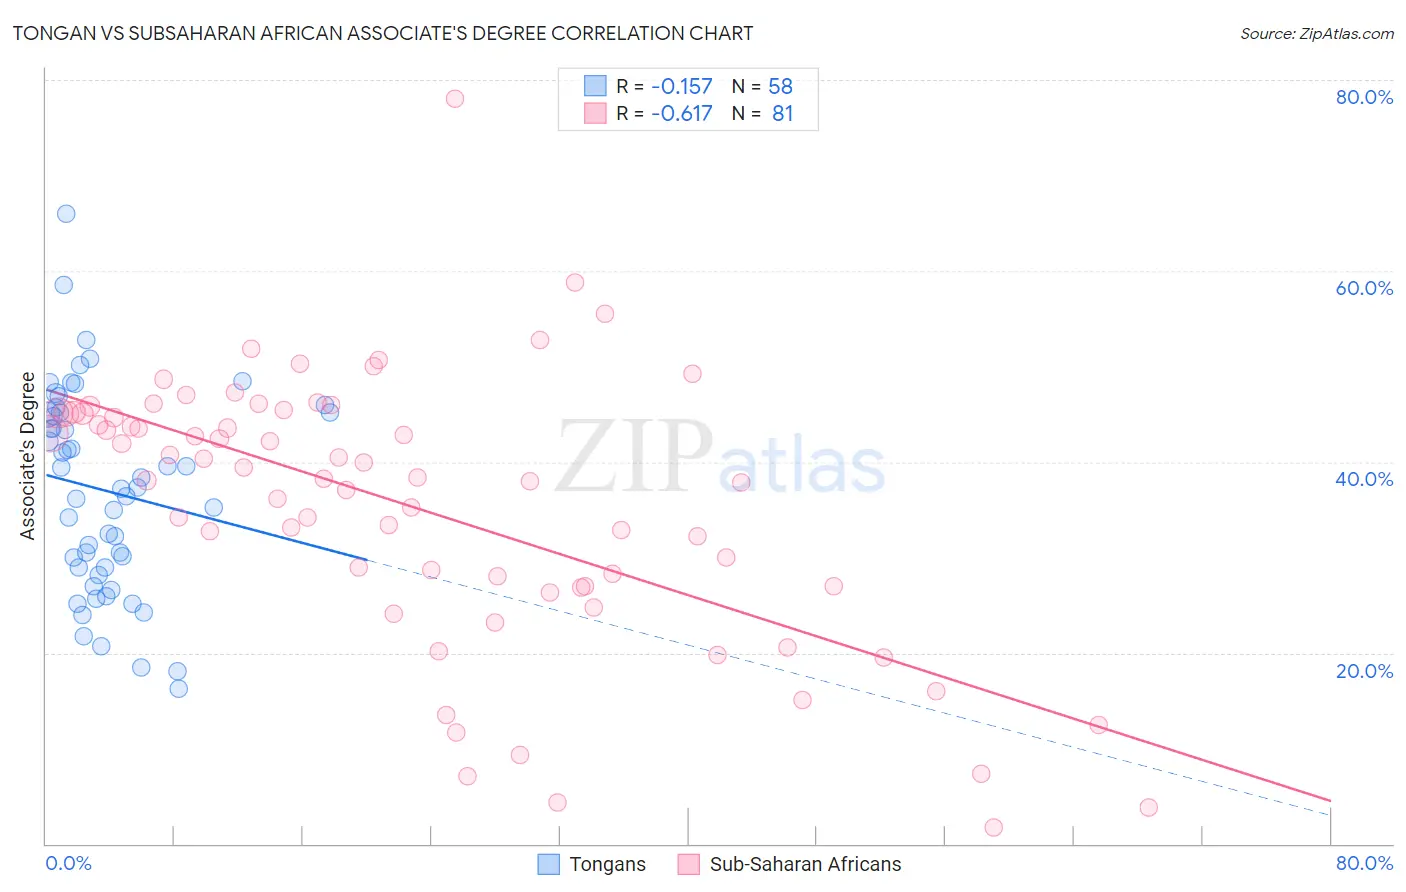
Tongan vs Subsaharan African Associate's Degree Correlation Chart
The statistical analysis conducted on geographies consisting of 102,908,759 people shows a poor negative correlation between the proportion of Tongans and percentage of population with at least associate's degree education in the United States with a correlation coefficient (R) of -0.157 and weighted average of 43.0%. Similarly, the statistical analysis conducted on geographies consisting of 508,152,134 people shows a significant negative correlation between the proportion of Sub-Saharan Africans and percentage of population with at least associate's degree education in the United States with a correlation coefficient (R) of -0.617 and weighted average of 43.9%, a difference of 2.0%.
Associate's Degree Correlation Summary
| Measurement | Tongan | Subsaharan African |
| Minimum | 16.2% | 1.7% |
| Maximum | 65.9% | 78.0% |
| Range | 49.7% | 76.2% |
| Mean | 37.0% | 35.2% |
| Median | 37.2% | 38.3% |
| Interquartile 25% (IQ1) | 28.9% | 26.9% |
| Interquartile 75% (IQ3) | 45.1% | 45.1% |
| Interquartile Range (IQR) | 16.2% | 18.2% |
| Standard Deviation (Sample) | 10.6% | 14.2% |
| Standard Deviation (Population) | 10.5% | 14.1% |
Demographics Similar to Tongans and Sub-Saharan Africans by Associate's Degree
In terms of associate's degree, the demographic groups most similar to Tongans are Tlingit-Haida (43.0%, a difference of 0.090%), Native Hawaiian (43.1%, a difference of 0.16%), Ecuadorian (43.0%, a difference of 0.19%), Immigrants from St. Vincent and the Grenadines (42.9%, a difference of 0.27%), and Nonimmigrants (42.9%, a difference of 0.29%). Similarly, the demographic groups most similar to Sub-Saharan Africans are Barbadian (43.9%, a difference of 0.10%), West Indian (43.8%, a difference of 0.14%), Guamanian/Chamorro (43.8%, a difference of 0.29%), Immigrants from Western Africa (44.1%, a difference of 0.37%), and Immigrants from Burma/Myanmar (43.7%, a difference of 0.51%).
| Demographics | Rating | Rank | Associate's Degree |
| Spanish | 9.4 /100 | #218 | Tragic 44.4% |
| Whites/Caucasians | 7.5 /100 | #219 | Tragic 44.2% |
| Portuguese | 7.2 /100 | #220 | Tragic 44.1% |
| Immigrants | Western Africa | 6.6 /100 | #221 | Tragic 44.1% |
| Barbadians | 5.8 /100 | #222 | Tragic 43.9% |
| Sub-Saharan Africans | 5.5 /100 | #223 | Tragic 43.9% |
| West Indians | 5.2 /100 | #224 | Tragic 43.8% |
| Guamanians/Chamorros | 4.8 /100 | #225 | Tragic 43.8% |
| Immigrants | Burma/Myanmar | 4.3 /100 | #226 | Tragic 43.7% |
| Trinidadians and Tobagonians | 4.0 /100 | #227 | Tragic 43.6% |
| Hmong | 3.2 /100 | #228 | Tragic 43.4% |
| Immigrants | Trinidad and Tobago | 3.0 /100 | #229 | Tragic 43.3% |
| Immigrants | Barbados | 2.9 /100 | #230 | Tragic 43.3% |
| Liberians | 2.9 /100 | #231 | Tragic 43.3% |
| Native Hawaiians | 2.3 /100 | #232 | Tragic 43.1% |
| Tongans | 2.2 /100 | #233 | Tragic 43.0% |
| Tlingit-Haida | 2.1 /100 | #234 | Tragic 43.0% |
| Ecuadorians | 2.0 /100 | #235 | Tragic 43.0% |
| Immigrants | St. Vincent and the Grenadines | 1.9 /100 | #236 | Tragic 42.9% |
| Immigrants | Nonimmigrants | 1.9 /100 | #237 | Tragic 42.9% |
| Iroquois | 1.7 /100 | #238 | Tragic 42.8% |