Tohono O'odham vs Mongolian Poverty
COMPARE
Tohono O'odham
Mongolian
Poverty
Poverty Comparison
Tohono O'odham
Mongolians
24.4%
POVERTY
0.0/ 100
METRIC RATING
347th/ 347
METRIC RANK
12.4%
POVERTY
43.6/ 100
METRIC RATING
180th/ 347
METRIC RANK
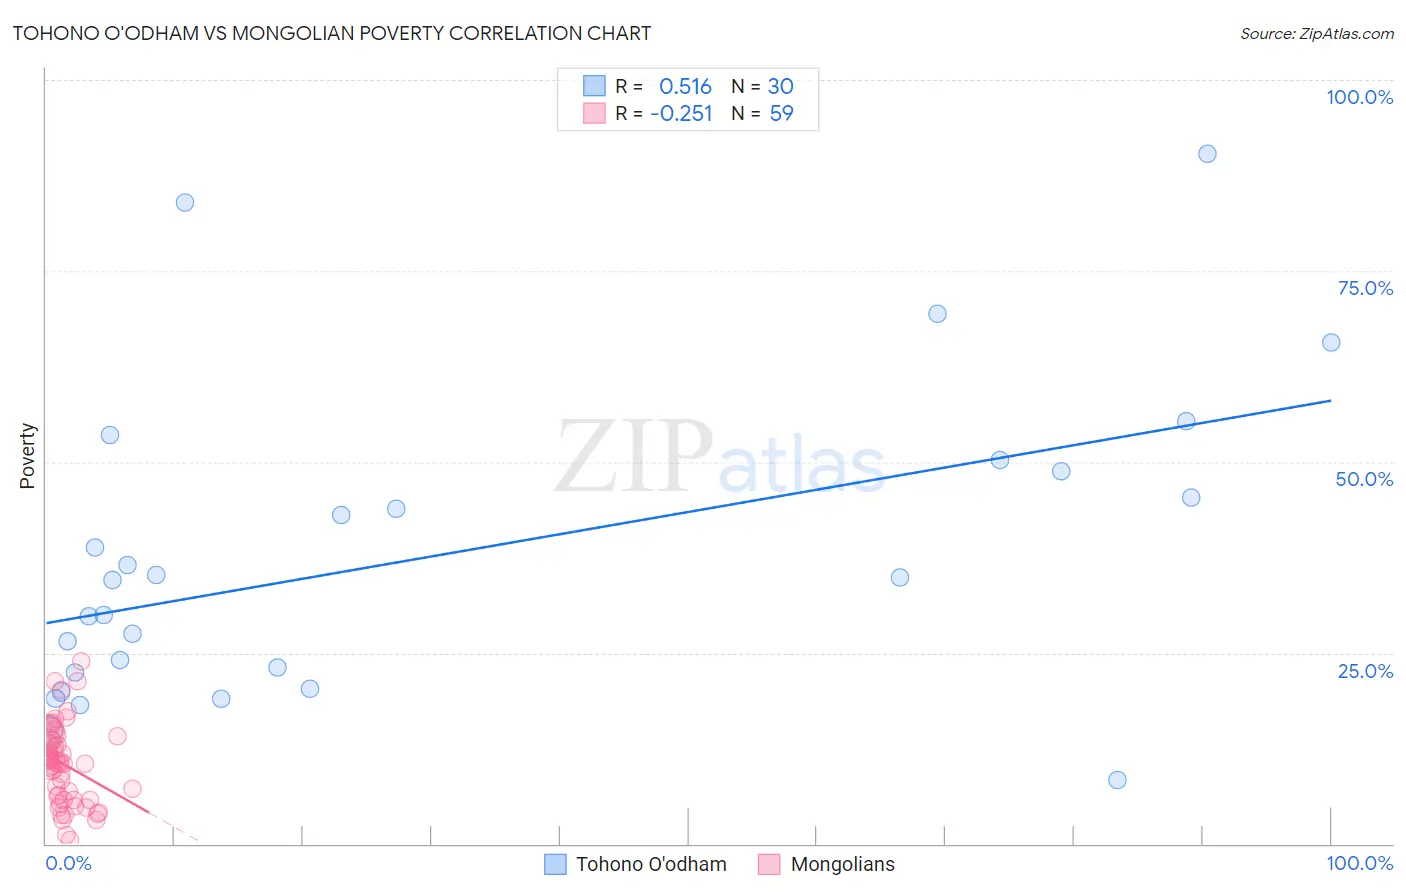
Tohono O'odham vs Mongolian Poverty Correlation Chart
The statistical analysis conducted on geographies consisting of 58,718,506 people shows a substantial positive correlation between the proportion of Tohono O'odham and poverty level in the United States with a correlation coefficient (R) of 0.516 and weighted average of 24.4%. Similarly, the statistical analysis conducted on geographies consisting of 140,290,240 people shows a weak negative correlation between the proportion of Mongolians and poverty level in the United States with a correlation coefficient (R) of -0.251 and weighted average of 12.4%, a difference of 96.8%.
Poverty Correlation Summary
| Measurement | Tohono O'odham | Mongolian |
| Minimum | 8.3% | 0.57% |
| Maximum | 90.4% | 23.9% |
| Range | 82.0% | 23.3% |
| Mean | 37.7% | 10.4% |
| Median | 34.7% | 10.6% |
| Interquartile 25% (IQ1) | 22.4% | 5.7% |
| Interquartile 75% (IQ3) | 48.7% | 13.6% |
| Interquartile Range (IQR) | 26.3% | 7.9% |
| Standard Deviation (Sample) | 20.1% | 5.2% |
| Standard Deviation (Population) | 19.8% | 5.1% |
Similar Demographics by Poverty
Demographics Similar to Tohono O'odham by Poverty
In terms of poverty, the demographic groups most similar to Tohono O'odham are Puerto Rican (23.7%, a difference of 3.1%), Navajo (23.1%, a difference of 5.7%), Lumbee (21.9%, a difference of 11.3%), Pima (21.9%, a difference of 11.6%), and Immigrants from Yemen (21.5%, a difference of 13.4%).
| Demographics | Rating | Rank | Poverty |
| Houma | 0.0 /100 | #333 | Tragic 18.4% |
| Apache | 0.0 /100 | #334 | Tragic 18.4% |
| Cheyenne | 0.0 /100 | #335 | Tragic 18.9% |
| Pueblo | 0.0 /100 | #336 | Tragic 19.4% |
| Sioux | 0.0 /100 | #337 | Tragic 19.8% |
| Yuman | 0.0 /100 | #338 | Tragic 20.2% |
| Crow | 0.0 /100 | #339 | Tragic 20.7% |
| Yup'ik | 0.0 /100 | #340 | Tragic 20.8% |
| Hopi | 0.0 /100 | #341 | Tragic 20.8% |
| Immigrants | Yemen | 0.0 /100 | #342 | Tragic 21.5% |
| Pima | 0.0 /100 | #343 | Tragic 21.9% |
| Lumbee | 0.0 /100 | #344 | Tragic 21.9% |
| Navajo | 0.0 /100 | #345 | Tragic 23.1% |
| Puerto Ricans | 0.0 /100 | #346 | Tragic 23.7% |
| Tohono O'odham | 0.0 /100 | #347 | Tragic 24.4% |
Demographics Similar to Mongolians by Poverty
In terms of poverty, the demographic groups most similar to Mongolians are Immigrants from Morocco (12.4%, a difference of 0.040%), Uruguayan (12.4%, a difference of 0.10%), Immigrants from Afghanistan (12.4%, a difference of 0.15%), Immigrants from Cameroon (12.4%, a difference of 0.19%), and Immigrants from Iraq (12.4%, a difference of 0.34%).
| Demographics | Rating | Rank | Poverty |
| Celtics | 50.1 /100 | #173 | Average 12.3% |
| Lebanese | 50.0 /100 | #174 | Average 12.3% |
| South Americans | 48.7 /100 | #175 | Average 12.3% |
| Immigrants | Colombia | 47.7 /100 | #176 | Average 12.3% |
| Immigrants | Syria | 47.5 /100 | #177 | Average 12.3% |
| Uruguayans | 44.7 /100 | #178 | Average 12.4% |
| Immigrants | Morocco | 44.0 /100 | #179 | Average 12.4% |
| Mongolians | 43.6 /100 | #180 | Average 12.4% |
| Immigrants | Afghanistan | 42.1 /100 | #181 | Average 12.4% |
| Immigrants | Cameroon | 41.7 /100 | #182 | Average 12.4% |
| Immigrants | Iraq | 40.2 /100 | #183 | Average 12.4% |
| Kenyans | 38.8 /100 | #184 | Fair 12.5% |
| Israelis | 36.4 /100 | #185 | Fair 12.5% |
| Immigrants | Sierra Leone | 36.3 /100 | #186 | Fair 12.5% |
| Hawaiians | 34.1 /100 | #187 | Fair 12.5% |