Tohono O'odham vs Immigrants from Denmark Poverty
COMPARE
Tohono O'odham
Immigrants from Denmark
Poverty
Poverty Comparison
Tohono O'odham
Immigrants from Denmark
24.4%
POVERTY
0.0/ 100
METRIC RATING
347th/ 347
METRIC RANK
11.4%
POVERTY
95.5/ 100
METRIC RATING
90th/ 347
METRIC RANK
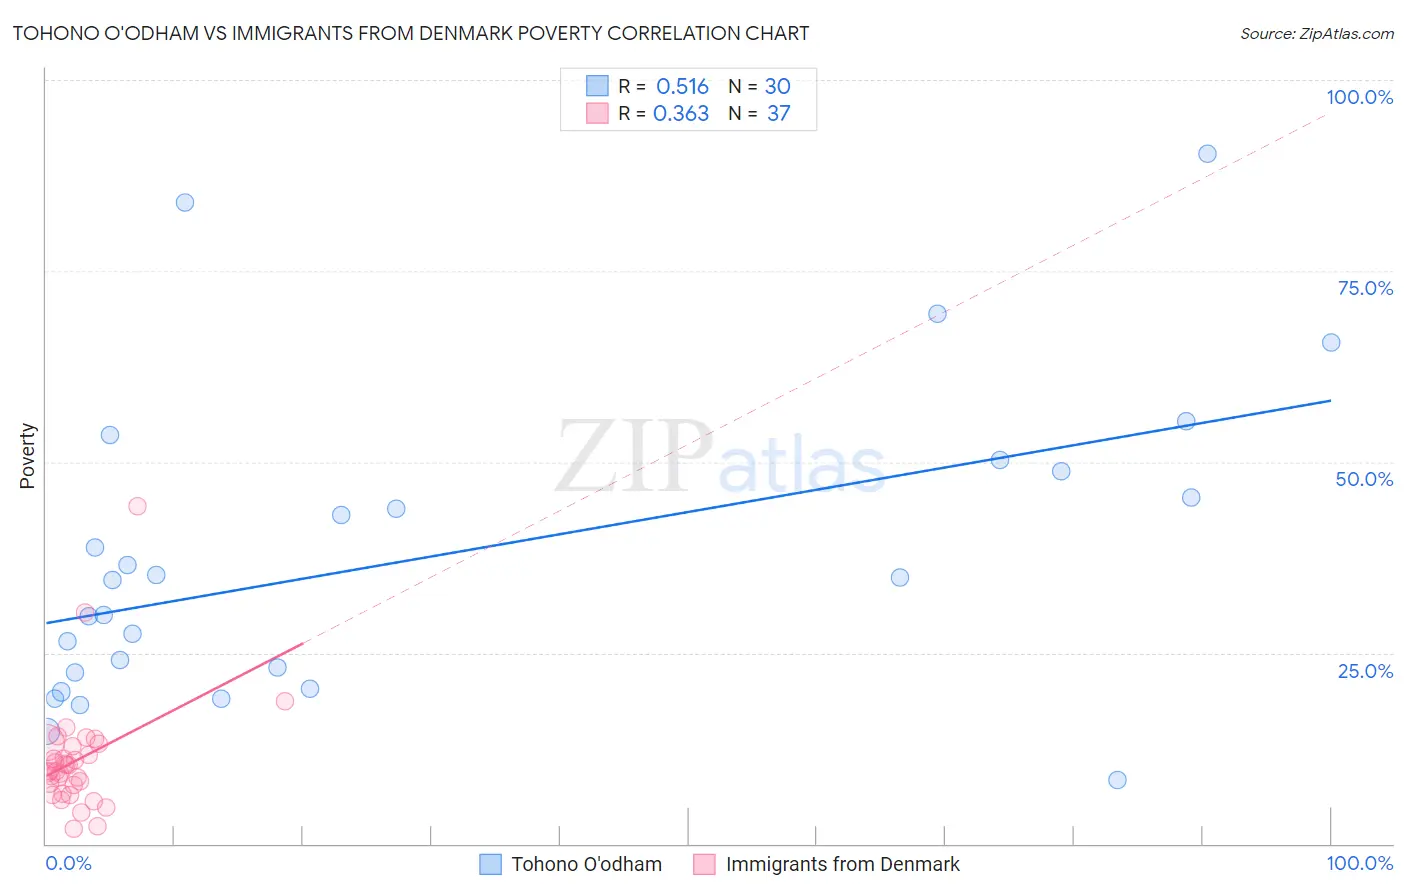
Tohono O'odham vs Immigrants from Denmark Poverty Correlation Chart
The statistical analysis conducted on geographies consisting of 58,718,506 people shows a substantial positive correlation between the proportion of Tohono O'odham and poverty level in the United States with a correlation coefficient (R) of 0.516 and weighted average of 24.4%. Similarly, the statistical analysis conducted on geographies consisting of 136,404,120 people shows a mild positive correlation between the proportion of Immigrants from Denmark and poverty level in the United States with a correlation coefficient (R) of 0.363 and weighted average of 11.4%, a difference of 113.8%.
Poverty Correlation Summary
| Measurement | Tohono O'odham | Immigrants from Denmark |
| Minimum | 8.3% | 1.9% |
| Maximum | 90.4% | 44.2% |
| Range | 82.0% | 42.3% |
| Mean | 37.7% | 11.0% |
| Median | 34.7% | 9.6% |
| Interquartile 25% (IQ1) | 22.4% | 7.1% |
| Interquartile 75% (IQ3) | 48.7% | 13.0% |
| Interquartile Range (IQR) | 26.3% | 5.9% |
| Standard Deviation (Sample) | 20.1% | 7.5% |
| Standard Deviation (Population) | 19.8% | 7.4% |
Similar Demographics by Poverty
Demographics Similar to Tohono O'odham by Poverty
In terms of poverty, the demographic groups most similar to Tohono O'odham are Puerto Rican (23.7%, a difference of 3.1%), Navajo (23.1%, a difference of 5.7%), Lumbee (21.9%, a difference of 11.3%), Pima (21.9%, a difference of 11.6%), and Immigrants from Yemen (21.5%, a difference of 13.4%).
| Demographics | Rating | Rank | Poverty |
| Houma | 0.0 /100 | #333 | Tragic 18.4% |
| Apache | 0.0 /100 | #334 | Tragic 18.4% |
| Cheyenne | 0.0 /100 | #335 | Tragic 18.9% |
| Pueblo | 0.0 /100 | #336 | Tragic 19.4% |
| Sioux | 0.0 /100 | #337 | Tragic 19.8% |
| Yuman | 0.0 /100 | #338 | Tragic 20.2% |
| Crow | 0.0 /100 | #339 | Tragic 20.7% |
| Yup'ik | 0.0 /100 | #340 | Tragic 20.8% |
| Hopi | 0.0 /100 | #341 | Tragic 20.8% |
| Immigrants | Yemen | 0.0 /100 | #342 | Tragic 21.5% |
| Pima | 0.0 /100 | #343 | Tragic 21.9% |
| Lumbee | 0.0 /100 | #344 | Tragic 21.9% |
| Navajo | 0.0 /100 | #345 | Tragic 23.1% |
| Puerto Ricans | 0.0 /100 | #346 | Tragic 23.7% |
| Tohono O'odham | 0.0 /100 | #347 | Tragic 24.4% |
Demographics Similar to Immigrants from Denmark by Poverty
In terms of poverty, the demographic groups most similar to Immigrants from Denmark are Finnish (11.4%, a difference of 0.13%), Czechoslovakian (11.4%, a difference of 0.17%), Belgian (11.4%, a difference of 0.20%), British (11.4%, a difference of 0.27%), and Romanian (11.4%, a difference of 0.31%).
| Demographics | Rating | Rank | Poverty |
| Immigrants | Sweden | 96.3 /100 | #83 | Exceptional 11.3% |
| English | 96.3 /100 | #84 | Exceptional 11.3% |
| Immigrants | England | 96.2 /100 | #85 | Exceptional 11.4% |
| Jordanians | 96.0 /100 | #86 | Exceptional 11.4% |
| Northern Europeans | 96.0 /100 | #87 | Exceptional 11.4% |
| Belgians | 95.8 /100 | #88 | Exceptional 11.4% |
| Czechoslovakians | 95.7 /100 | #89 | Exceptional 11.4% |
| Immigrants | Denmark | 95.5 /100 | #90 | Exceptional 11.4% |
| Finns | 95.2 /100 | #91 | Exceptional 11.4% |
| British | 95.0 /100 | #92 | Exceptional 11.4% |
| Romanians | 94.9 /100 | #93 | Exceptional 11.4% |
| Paraguayans | 94.9 /100 | #94 | Exceptional 11.4% |
| Australians | 94.9 /100 | #95 | Exceptional 11.4% |
| Immigrants | South Africa | 94.7 /100 | #96 | Exceptional 11.5% |
| Immigrants | Egypt | 94.6 /100 | #97 | Exceptional 11.5% |