Immigrants from Asia vs Mongolian Poverty
COMPARE
Immigrants from Asia
Mongolian
Poverty
Poverty Comparison
Immigrants from Asia
Mongolians
11.2%
POVERTY
97.5/ 100
METRIC RATING
65th/ 347
METRIC RANK
12.4%
POVERTY
43.6/ 100
METRIC RATING
180th/ 347
METRIC RANK
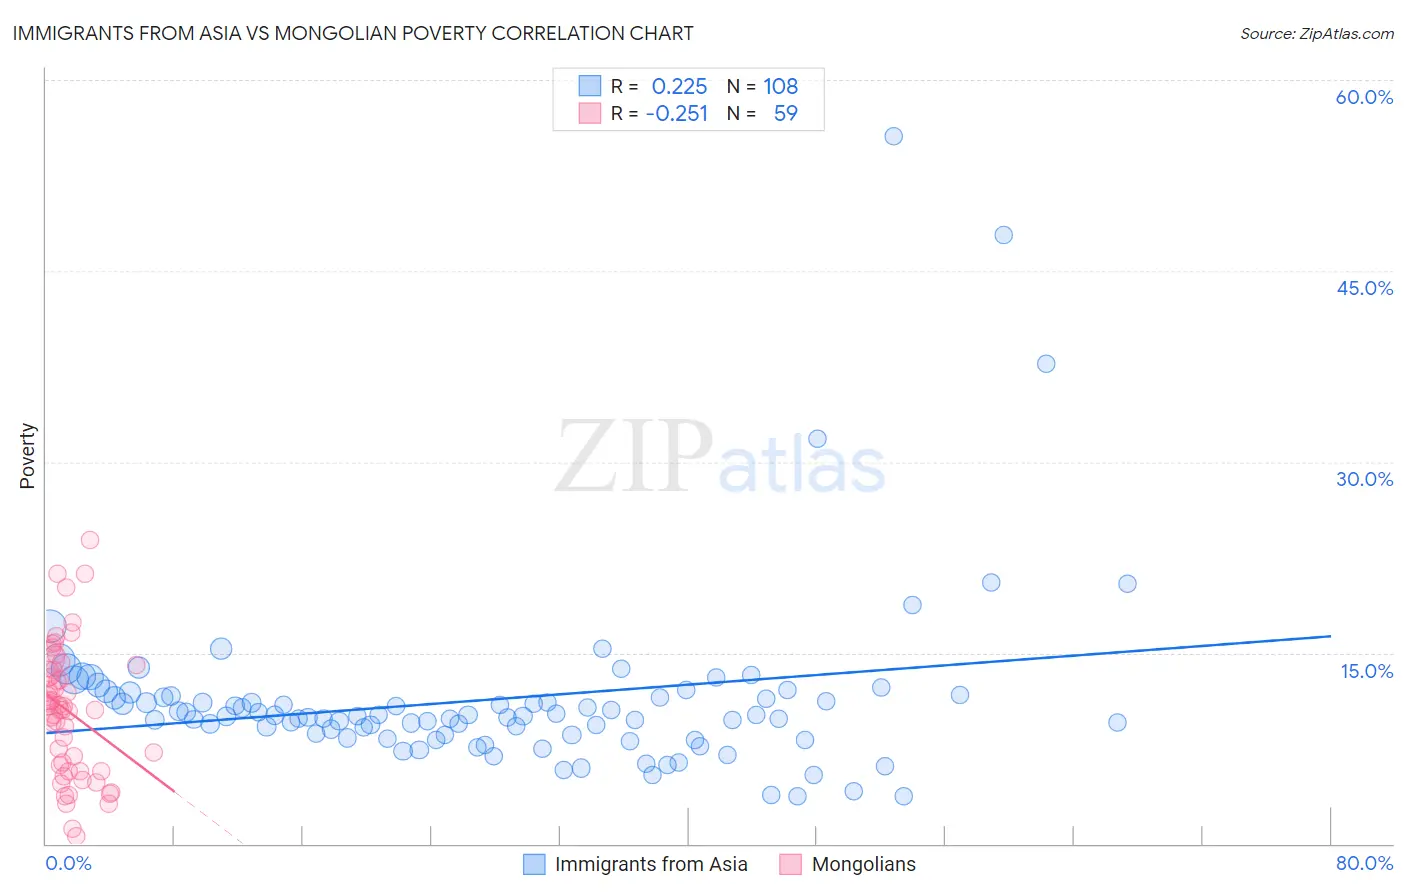
Immigrants from Asia vs Mongolian Poverty Correlation Chart
The statistical analysis conducted on geographies consisting of 548,468,106 people shows a weak positive correlation between the proportion of Immigrants from Asia and poverty level in the United States with a correlation coefficient (R) of 0.225 and weighted average of 11.2%. Similarly, the statistical analysis conducted on geographies consisting of 140,290,240 people shows a weak negative correlation between the proportion of Mongolians and poverty level in the United States with a correlation coefficient (R) of -0.251 and weighted average of 12.4%, a difference of 10.5%.
Poverty Correlation Summary
| Measurement | Immigrants from Asia | Mongolian |
| Minimum | 3.7% | 0.57% |
| Maximum | 55.6% | 23.9% |
| Range | 51.8% | 23.3% |
| Mean | 11.3% | 10.4% |
| Median | 10.0% | 10.6% |
| Interquartile 25% (IQ1) | 8.5% | 5.7% |
| Interquartile 75% (IQ3) | 11.6% | 13.6% |
| Interquartile Range (IQR) | 3.0% | 7.9% |
| Standard Deviation (Sample) | 7.2% | 5.2% |
| Standard Deviation (Population) | 7.1% | 5.1% |
Similar Demographics by Poverty
Demographics Similar to Immigrants from Asia by Poverty
In terms of poverty, the demographic groups most similar to Immigrants from Asia are Immigrants from Netherlands (11.2%, a difference of 0.070%), Immigrants from Australia (11.2%, a difference of 0.11%), Swiss (11.2%, a difference of 0.13%), Slovak (11.2%, a difference of 0.13%), and Serbian (11.2%, a difference of 0.19%).
| Demographics | Rating | Rank | Poverty |
| Germans | 98.1 /100 | #58 | Exceptional 11.1% |
| Immigrants | Europe | 98.0 /100 | #59 | Exceptional 11.2% |
| Immigrants | Sri Lanka | 97.9 /100 | #60 | Exceptional 11.2% |
| Immigrants | Italy | 97.9 /100 | #61 | Exceptional 11.2% |
| Austrians | 97.8 /100 | #62 | Exceptional 11.2% |
| Ukrainians | 97.8 /100 | #63 | Exceptional 11.2% |
| Swiss | 97.7 /100 | #64 | Exceptional 11.2% |
| Immigrants | Asia | 97.5 /100 | #65 | Exceptional 11.2% |
| Immigrants | Netherlands | 97.5 /100 | #66 | Exceptional 11.2% |
| Immigrants | Australia | 97.4 /100 | #67 | Exceptional 11.2% |
| Slovaks | 97.4 /100 | #68 | Exceptional 11.2% |
| Serbians | 97.4 /100 | #69 | Exceptional 11.2% |
| Immigrants | Canada | 97.3 /100 | #70 | Exceptional 11.3% |
| Zimbabweans | 97.3 /100 | #71 | Exceptional 11.3% |
| Europeans | 97.2 /100 | #72 | Exceptional 11.3% |
Demographics Similar to Mongolians by Poverty
In terms of poverty, the demographic groups most similar to Mongolians are Immigrants from Morocco (12.4%, a difference of 0.040%), Uruguayan (12.4%, a difference of 0.10%), Immigrants from Afghanistan (12.4%, a difference of 0.15%), Immigrants from Cameroon (12.4%, a difference of 0.19%), and Immigrants from Iraq (12.4%, a difference of 0.34%).
| Demographics | Rating | Rank | Poverty |
| Celtics | 50.1 /100 | #173 | Average 12.3% |
| Lebanese | 50.0 /100 | #174 | Average 12.3% |
| South Americans | 48.7 /100 | #175 | Average 12.3% |
| Immigrants | Colombia | 47.7 /100 | #176 | Average 12.3% |
| Immigrants | Syria | 47.5 /100 | #177 | Average 12.3% |
| Uruguayans | 44.7 /100 | #178 | Average 12.4% |
| Immigrants | Morocco | 44.0 /100 | #179 | Average 12.4% |
| Mongolians | 43.6 /100 | #180 | Average 12.4% |
| Immigrants | Afghanistan | 42.1 /100 | #181 | Average 12.4% |
| Immigrants | Cameroon | 41.7 /100 | #182 | Average 12.4% |
| Immigrants | Iraq | 40.2 /100 | #183 | Average 12.4% |
| Kenyans | 38.8 /100 | #184 | Fair 12.5% |
| Israelis | 36.4 /100 | #185 | Fair 12.5% |
| Immigrants | Sierra Leone | 36.3 /100 | #186 | Fair 12.5% |
| Hawaiians | 34.1 /100 | #187 | Fair 12.5% |