Tohono O'odham vs Nonimmigrants Poverty
COMPARE
Tohono O'odham
Nonimmigrants
Poverty
Poverty Comparison
Tohono O'odham
Nonimmigrants
24.4%
POVERTY
0.0/ 100
METRIC RATING
347th/ 347
METRIC RANK
13.3%
POVERTY
3.3/ 100
METRIC RATING
216th/ 347
METRIC RANK
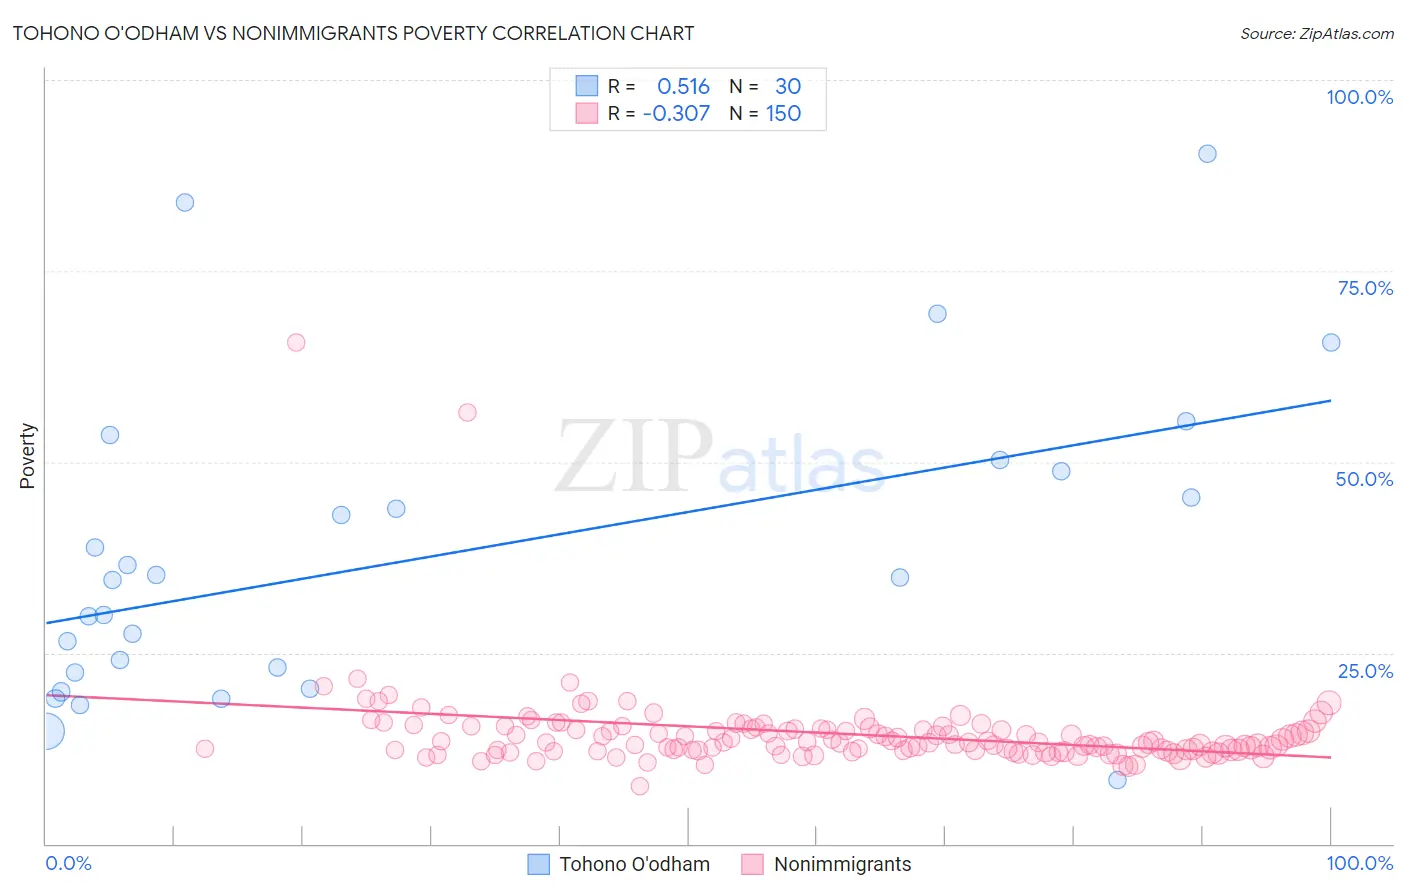
Tohono O'odham vs Nonimmigrants Poverty Correlation Chart
The statistical analysis conducted on geographies consisting of 58,718,506 people shows a substantial positive correlation between the proportion of Tohono O'odham and poverty level in the United States with a correlation coefficient (R) of 0.516 and weighted average of 24.4%. Similarly, the statistical analysis conducted on geographies consisting of 583,909,037 people shows a mild negative correlation between the proportion of Nonimmigrants and poverty level in the United States with a correlation coefficient (R) of -0.307 and weighted average of 13.3%, a difference of 83.1%.
Poverty Correlation Summary
| Measurement | Tohono O'odham | Nonimmigrants |
| Minimum | 8.3% | 7.5% |
| Maximum | 90.4% | 65.6% |
| Range | 82.0% | 58.1% |
| Mean | 37.7% | 14.4% |
| Median | 34.7% | 13.3% |
| Interquartile 25% (IQ1) | 22.4% | 12.2% |
| Interquartile 75% (IQ3) | 48.7% | 15.0% |
| Interquartile Range (IQR) | 26.3% | 2.7% |
| Standard Deviation (Sample) | 20.1% | 5.9% |
| Standard Deviation (Population) | 19.8% | 5.9% |
Similar Demographics by Poverty
Demographics Similar to Tohono O'odham by Poverty
In terms of poverty, the demographic groups most similar to Tohono O'odham are Puerto Rican (23.7%, a difference of 3.1%), Navajo (23.1%, a difference of 5.7%), Lumbee (21.9%, a difference of 11.3%), Pima (21.9%, a difference of 11.6%), and Immigrants from Yemen (21.5%, a difference of 13.4%).
| Demographics | Rating | Rank | Poverty |
| Houma | 0.0 /100 | #333 | Tragic 18.4% |
| Apache | 0.0 /100 | #334 | Tragic 18.4% |
| Cheyenne | 0.0 /100 | #335 | Tragic 18.9% |
| Pueblo | 0.0 /100 | #336 | Tragic 19.4% |
| Sioux | 0.0 /100 | #337 | Tragic 19.8% |
| Yuman | 0.0 /100 | #338 | Tragic 20.2% |
| Crow | 0.0 /100 | #339 | Tragic 20.7% |
| Yup'ik | 0.0 /100 | #340 | Tragic 20.8% |
| Hopi | 0.0 /100 | #341 | Tragic 20.8% |
| Immigrants | Yemen | 0.0 /100 | #342 | Tragic 21.5% |
| Pima | 0.0 /100 | #343 | Tragic 21.9% |
| Lumbee | 0.0 /100 | #344 | Tragic 21.9% |
| Navajo | 0.0 /100 | #345 | Tragic 23.1% |
| Puerto Ricans | 0.0 /100 | #346 | Tragic 23.7% |
| Tohono O'odham | 0.0 /100 | #347 | Tragic 24.4% |
Demographics Similar to Nonimmigrants by Poverty
In terms of poverty, the demographic groups most similar to Nonimmigrants are Japanese (13.3%, a difference of 0.0%), Immigrants from Uzbekistan (13.3%, a difference of 0.040%), Immigrants from Thailand (13.3%, a difference of 0.10%), Immigrants from Cambodia (13.4%, a difference of 0.23%), and Bermudan (13.3%, a difference of 0.26%).
| Demographics | Rating | Rank | Poverty |
| Malaysians | 6.1 /100 | #209 | Tragic 13.1% |
| Immigrants | Azores | 6.1 /100 | #210 | Tragic 13.1% |
| Moroccans | 5.2 /100 | #211 | Tragic 13.2% |
| Immigrants | Immigrants | 4.3 /100 | #212 | Tragic 13.2% |
| Immigrants | Panama | 4.1 /100 | #213 | Tragic 13.3% |
| Bermudans | 3.7 /100 | #214 | Tragic 13.3% |
| Japanese | 3.3 /100 | #215 | Tragic 13.3% |
| Immigrants | Nonimmigrants | 3.3 /100 | #216 | Tragic 13.3% |
| Immigrants | Uzbekistan | 3.2 /100 | #217 | Tragic 13.3% |
| Immigrants | Thailand | 3.1 /100 | #218 | Tragic 13.3% |
| Immigrants | Cambodia | 3.0 /100 | #219 | Tragic 13.4% |
| Americans | 2.9 /100 | #220 | Tragic 13.4% |
| Alsatians | 2.6 /100 | #221 | Tragic 13.4% |
| Immigrants | Micronesia | 2.6 /100 | #222 | Tragic 13.4% |
| Immigrants | Africa | 2.5 /100 | #223 | Tragic 13.4% |