Choctaw vs Mongolian Poverty
COMPARE
Choctaw
Mongolian
Poverty
Poverty Comparison
Choctaw
Mongolians
15.6%
POVERTY
0.0/ 100
METRIC RATING
308th/ 347
METRIC RANK
12.4%
POVERTY
43.6/ 100
METRIC RATING
180th/ 347
METRIC RANK
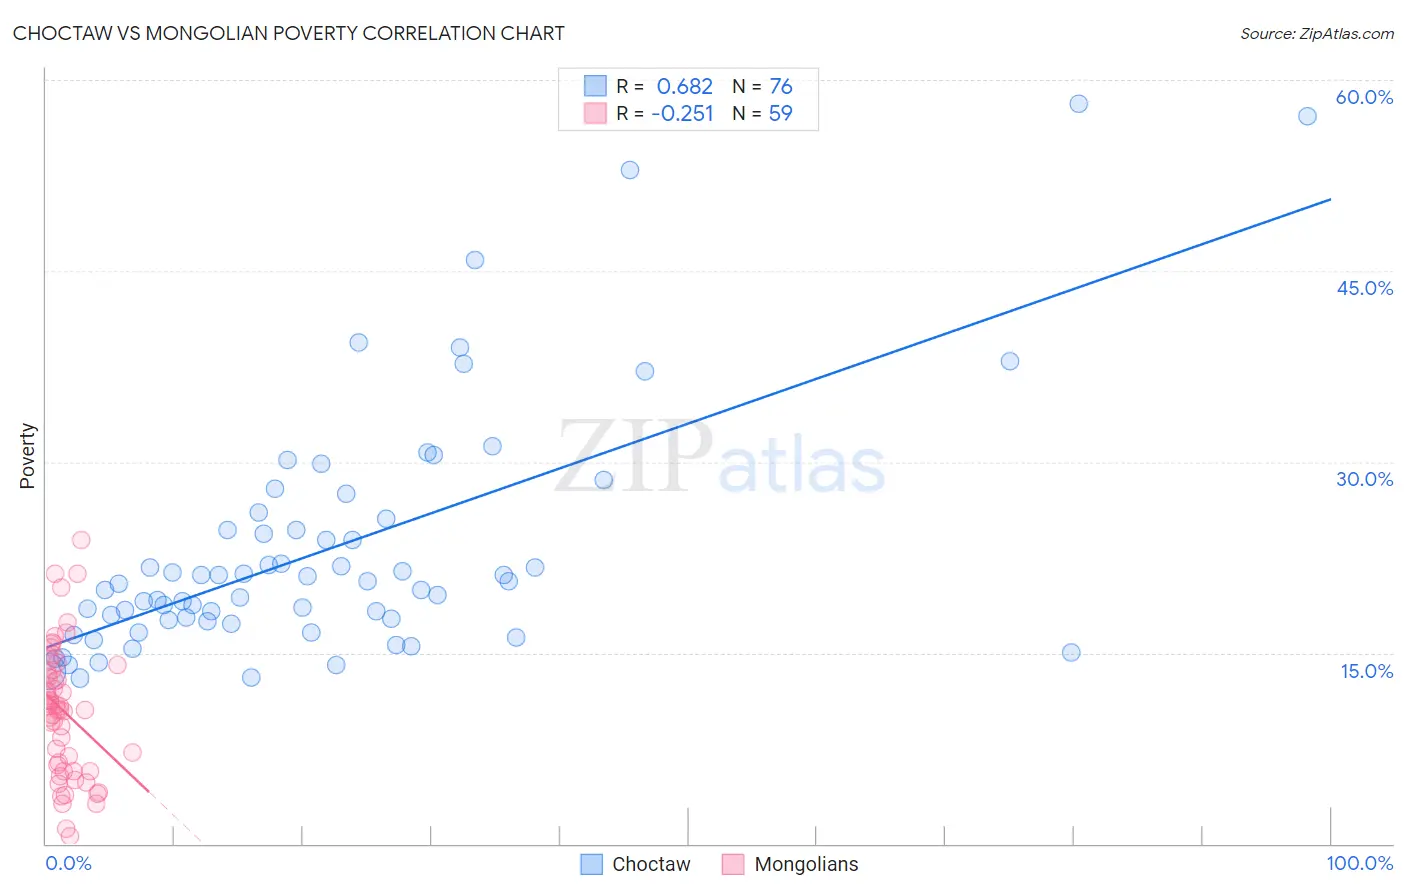
Choctaw vs Mongolian Poverty Correlation Chart
The statistical analysis conducted on geographies consisting of 269,626,558 people shows a significant positive correlation between the proportion of Choctaw and poverty level in the United States with a correlation coefficient (R) of 0.682 and weighted average of 15.6%. Similarly, the statistical analysis conducted on geographies consisting of 140,290,240 people shows a weak negative correlation between the proportion of Mongolians and poverty level in the United States with a correlation coefficient (R) of -0.251 and weighted average of 12.4%, a difference of 25.9%.
Poverty Correlation Summary
| Measurement | Choctaw | Mongolian |
| Minimum | 13.0% | 0.57% |
| Maximum | 58.1% | 23.9% |
| Range | 45.1% | 23.3% |
| Mean | 23.1% | 10.4% |
| Median | 20.5% | 10.6% |
| Interquartile 25% (IQ1) | 17.5% | 5.7% |
| Interquartile 75% (IQ3) | 25.1% | 13.6% |
| Interquartile Range (IQR) | 7.6% | 7.9% |
| Standard Deviation (Sample) | 9.6% | 5.2% |
| Standard Deviation (Population) | 9.6% | 5.1% |
Similar Demographics by Poverty
Demographics Similar to Choctaw by Poverty
In terms of poverty, the demographic groups most similar to Choctaw are Seminole (15.6%, a difference of 0.040%), African (15.6%, a difference of 0.11%), Dutch West Indian (15.6%, a difference of 0.13%), Creek (15.6%, a difference of 0.18%), and Chippewa (15.7%, a difference of 0.52%).
| Demographics | Rating | Rank | Poverty |
| Bahamians | 0.0 /100 | #301 | Tragic 15.4% |
| Somalis | 0.0 /100 | #302 | Tragic 15.4% |
| Immigrants | Caribbean | 0.0 /100 | #303 | Tragic 15.5% |
| Immigrants | Mexico | 0.0 /100 | #304 | Tragic 15.5% |
| Immigrants | Guatemala | 0.0 /100 | #305 | Tragic 15.5% |
| Creek | 0.0 /100 | #306 | Tragic 15.6% |
| Africans | 0.0 /100 | #307 | Tragic 15.6% |
| Choctaw | 0.0 /100 | #308 | Tragic 15.6% |
| Seminole | 0.0 /100 | #309 | Tragic 15.6% |
| Dutch West Indians | 0.0 /100 | #310 | Tragic 15.6% |
| Chippewa | 0.0 /100 | #311 | Tragic 15.7% |
| Cajuns | 0.0 /100 | #312 | Tragic 15.7% |
| Immigrants | Grenada | 0.0 /100 | #313 | Tragic 15.8% |
| Immigrants | Somalia | 0.0 /100 | #314 | Tragic 15.8% |
| British West Indians | 0.0 /100 | #315 | Tragic 15.9% |
Demographics Similar to Mongolians by Poverty
In terms of poverty, the demographic groups most similar to Mongolians are Immigrants from Morocco (12.4%, a difference of 0.040%), Uruguayan (12.4%, a difference of 0.10%), Immigrants from Afghanistan (12.4%, a difference of 0.15%), Immigrants from Cameroon (12.4%, a difference of 0.19%), and Immigrants from Iraq (12.4%, a difference of 0.34%).
| Demographics | Rating | Rank | Poverty |
| Celtics | 50.1 /100 | #173 | Average 12.3% |
| Lebanese | 50.0 /100 | #174 | Average 12.3% |
| South Americans | 48.7 /100 | #175 | Average 12.3% |
| Immigrants | Colombia | 47.7 /100 | #176 | Average 12.3% |
| Immigrants | Syria | 47.5 /100 | #177 | Average 12.3% |
| Uruguayans | 44.7 /100 | #178 | Average 12.4% |
| Immigrants | Morocco | 44.0 /100 | #179 | Average 12.4% |
| Mongolians | 43.6 /100 | #180 | Average 12.4% |
| Immigrants | Afghanistan | 42.1 /100 | #181 | Average 12.4% |
| Immigrants | Cameroon | 41.7 /100 | #182 | Average 12.4% |
| Immigrants | Iraq | 40.2 /100 | #183 | Average 12.4% |
| Kenyans | 38.8 /100 | #184 | Fair 12.5% |
| Israelis | 36.4 /100 | #185 | Fair 12.5% |
| Immigrants | Sierra Leone | 36.3 /100 | #186 | Fair 12.5% |
| Hawaiians | 34.1 /100 | #187 | Fair 12.5% |